
A video demonstrating the play back of a descent from a recent mountain bike ride on the vintage aircraft altitude indicator..
In this project, I use a Python script and an updated version of my digital-to-synchro project to replay my mountain bike climbs and descents at 60x real time speed on a vintage aircraft altitude indicator. The updated D2S converter fits on a single board and uses three Microchip MCP4802 DACs and three TI OPA548 power operational amplifiers to produce high-power 400 Hz AC waveforms to power and control the servo loop in the altitude indicator.
High-Level Overview

System block diagram.
The block diagram for this project is shown above. My watch records the time and my latitude, longitude, and elevation as I ride. After the ride, I export these data in a GPX file to a Raspberry Pi 400. On the Pi 400, a Python script reads the GPX file and outputs the elevation data from the file at 60x real time over its first TTL serial port to a Raspberry Pi Pico development board. The Python script also displays the current location on the ride on a graph of the elevation profile of the ride as it is being played back.
Software running on the Pico converts the stream of elevations to synchro angles corresponding to the elevations to be displayed on the altitude indicator. The outputs of the software are three 400 Hz signals. The first signal is a fixed-level 400 Hz signal used to generate the 400 Hz AC that powers the altitude indicator. The second two signals are the synchro format 400 Hz AC signals used to control the altitude displayed on the altitude indicator.
These signals are output over the Pico’s SPI bus to three MCP4802 8-bit dual channel DACs on the digital-to-synchro board. One channel on each DAC is used to control the DC offset of each of the AC signals. The second channel on each DAC outputs one of the three generated AC waveforms from the Pico.
The six outputs from the DACs are fed to three TI OPA548 high-voltage, high-current operational amplifiers. Each power op amp generates one output signal by subtracting the DC offset from the AC signal to center the final output at DC and amplifies the signal to the levels needed by the altitude indicator. The altitude indicator then indicates the elevation at that point along the ride.
We’ll cover each of these steps in greater detail going forward.
The Python Script
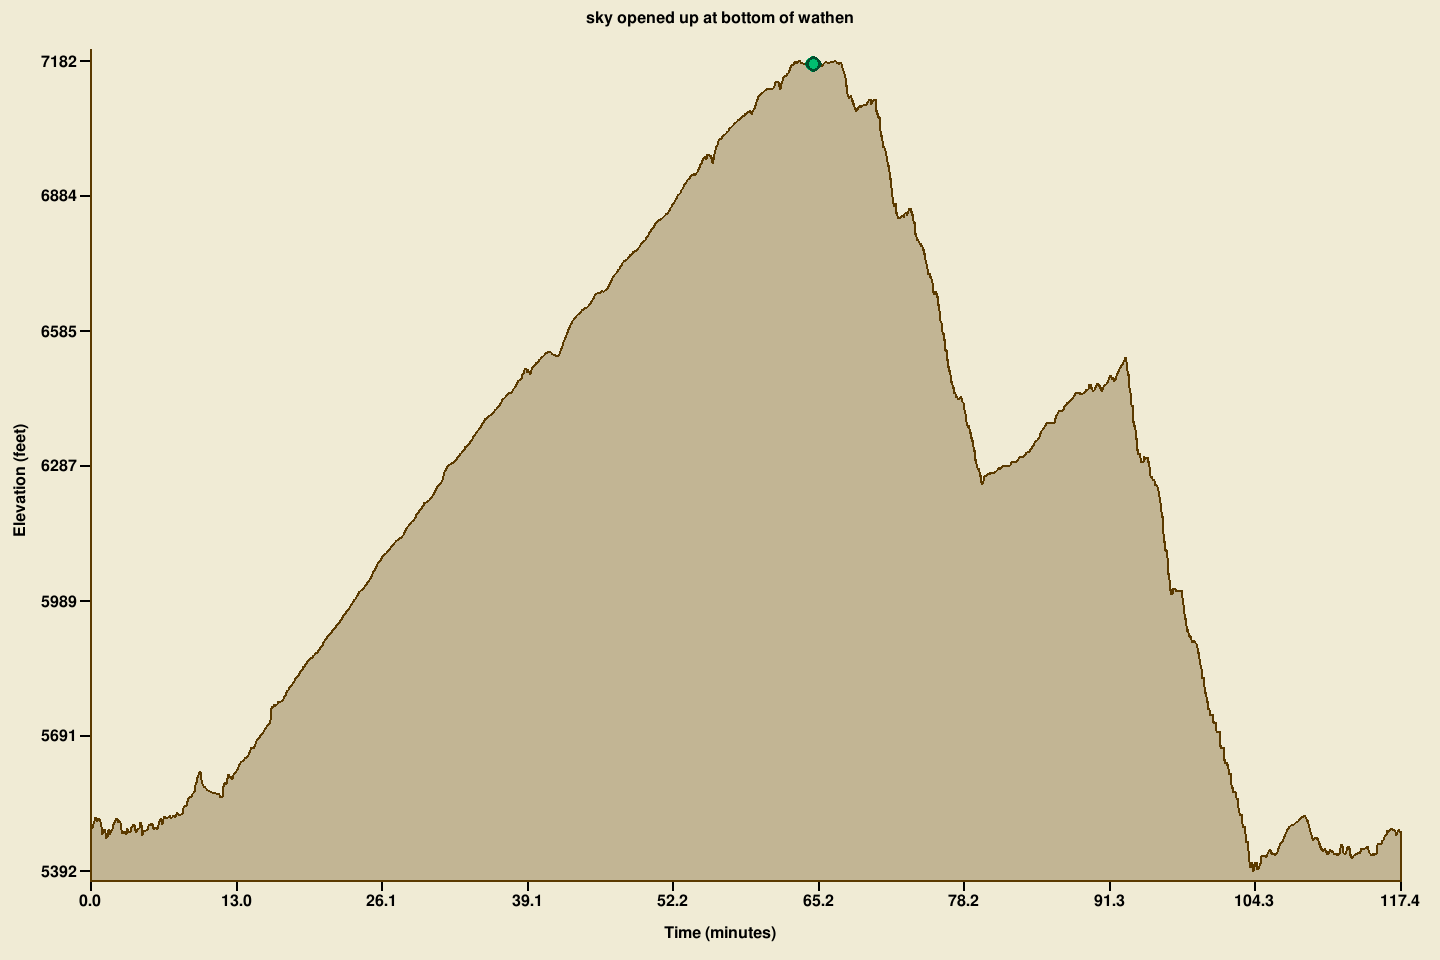
Elevation profile for a recent mountain bike ride showing time in minutes on the x axis and elevation in feet on the y axis. The green circle at the top is me waiting to start the descent.
The Python script uses the gpxpy module to parse the GPX file from the watch, the pygame module to graph the elevation profile, and the serial module to send the elevation data to the D2S converter. The vast majority of the code is dedicated to drawing the elevation profile.
At startup, the GPX file is loaded into memory and the first segment of the first track is converted into a list of points of the form (time since start of ride in seconds, elevation in feet). The minimum elevation, maximum elevation, and length of the ride are used to scale the display of the elevation profile to maximize its size in the available window area. The elevation profile is then drawn, labeled, and saved into a pygame surface.
Inside the pygame main loop, time starts at zero and is incremented second by second until the end of the ride. This is done no faster than 60 times a second resulting in the playback running at up to 60 times normal speed.
At each time step, a point of the form (time, elevation) is pulled from the previously generated list of points. If no point exists at a given time, the elevation of the previous point is used. The pre-drawn elevation profile is blitted into the pygame screen buffer, a green circle is drawn at that time and elevation, and the screen buffer is displayed.
Simultaneously, the elevation at that point is sent out the Pi 400’s serial port to the Pico for display on the altitude indicator. The end result is the altitude displayed on the altitude indicator moves in sync with the green dot moving up, down, and across the elevation profile.
Synchro Math Review
The altitude indicator uses a servo loop to control the position of the needle and value of the counter used to indicate altitude. We’ll discuss the details later but the important thing now is that the software and hardware need to generate sine waves to power and control the servo loop just like if it were controlling a synchro receiver.
Recall from my earlier synchro-to-digital converter project that the equation for the synchro reference voltage is:
Vref = VR2 – VR1 = A ⋅ sin ωt
And the equations for the synchro-format control voltages are:
VS1 – VS3 = k ⋅ A ⋅ sin ωt ⋅ sin θ
VS3 – VS2 = k ⋅ A ⋅ sin ωt ⋅ sin (θ + 120°)
VS2 – VS1 = k ⋅ A ⋅ sin ωt ⋅ sin (θ + 240°)
Where ω = 2πƒ, ƒ = 400 Hz, and sin ωt has the exact same phase in all the listed equations. θ corresponds to the angle of the shaft or magnetic field from 0 to 360° in the synchro component.
I don’t have access to fancy transformers to isolate the generated voltages so we’ll set VR2 = VS2 = 0 V by connecting them to ground. We’ll also simplify the equations because the amplitude, A, and the transfer ratio, k, are handled in hardware by the gains of the op amps. The first equation becomes
VR1 = – sin ωt (eq. i)
And the synchro-format equations become:
VS1 – VS3 = sin ωt ⋅ sin θ (eq. ii)
VS3 = sin ωt ⋅ sin (θ + 120°) (eq. iii)
VS1 = – sin ωt ⋅ sin (θ + 240°) (eq. iv)
The D2S board has three output channels. We’ll use channel 1 of the D2S board to generate VR1 and channels 2 and 3 of the D2S board to generate VS1 and VS3 respectively. The waveforms the software needs to generate on the three output channels are then described by the following equations:
VCH1 = – sin ωt
VCH2 = – sin ωt ⋅ sin (θ + 240°)
VCH3 = sin ωt ⋅ sin (θ + 120°)
Note that the eq. ii is redundant and the relationship between VS1 and VS3 is maintained using only the above voltage outputs.
The bottom line is that the software needs to generate three 400 Hz AC waveforms that are in phase with each other but varying in their amplitude according to the synchro shaft angle, θ.
If you need more background on synchros in general, I recommend reading my synchro-to-digital converter project write up. If you understand synchros in general but need to fill in the gaps in the description of this project, I recommend reading my first digital-to-synchro converter project write up.
Raspberry Pi Pico Dev Board Software
The Pico software for this project accepts an altitude to display on the indicator over the serial port. The altitude can range from 0 to 99,999 feet and can be entered directly by the user or can be an elevation from the Python script.
The software then generates the reference and synchro control voltages to move the altitude indicator from its current altitude to the entered altitude. This is done by gradually rotating the synchro shaft angle, θ, to the angle corresponding to the entered altitude.
On this indicator, θ = 60° corresponds to an altitude of 0 feet and every rotation of 360° corresponds to an increase of 10,000 feet in altitude. After ten complete rotations of 360° each, the indicated altitude wraps back to 0 feet. (The offset of 60° at 0 feet is most likely a wire ordering or software issue.)
The practical implication is 60° could represent 0 feet, 10,000 feet, 20,000 feet, etc., and the magnetic fields and gears in the altitude indicator must be physically rotated through complete turns to reach the next increment of 10,000 feet. In other words, you can’t move from 0 feet to 35,000 feet without also running through 10,000 feet, 20,000 feet, and 30,000 feet first.
This is implemented in software by accepting an altitude from 0 to 99,999 feet through the serial port and converting the altitude to a target angle from 60° to 3660°:
altitude = fmod (atof (buffptr), 100000.0);
target = 60.0 + altitude / 10000.0 * 360.0;
printf ("target = %6.2f\n", target);
Then at 200 Hz, the software moves the current angle, θ, toward the target angle in steps of 0.2° until θ equals the target angle:
if (theta < target) {
    if (target - theta < 0.2) {
        theta = target;
    } else {
        theta = theta + 0.2;
    }
} else if (theta > target) {
    if (theta - target < 0.2) {
        theta = target;
    } else {
        theta = theta - 0.2;
    }
}
After updating θ, the new synchro control voltage amplitudes are calculated and passed to the ISR that generates the three 400 Hz signals. Note that newScale1 controls the amplitude of output channel 2 and newScale2 controls the amplitude of output channel 3:
newScale1 = -sin ((theta + 240)*M_PI/180.0); // s1 / yellow
newScale2 =  sin ((theta + 120)*M_PI/180.0); // s3 / blue
critical_section_enter_blocking (&scale_critsec);
scaleDac1 = newScale1;
scaleDac2 = newScale2;
critical_section_exit (&scale_critsec);
Then an ISR running at 40 kHz calculates the sine waves using a phase accumulator and sine lookup table and outputs the sine waves to the three DACs on the digital-to-synchro board:
bool repeating_timer_callback_40kHz (struct repeating_timer *t)
{
    uint16_t a;

    a = 0xB000 | ((uint16_t)dac0B << 4);
    gpio_put (SPI_CS0n_PIN, 0);
    spi_write16_blocking (SPI_IF, &a, 1);
    gpio_put (SPI_CS0n_PIN, 1);

    a = 0xB000 | ((uint16_t)dac1B << 4);
    gpio_put (SPI_CS1n_PIN, 0);
    spi_write16_blocking (SPI_IF, &a, 1);
    gpio_put (SPI_CS1n_PIN, 1);

    a = 0xB000 | ((uint16_t)dac2B << 4);
    gpio_put (SPI_CS2n_PIN, 0);
    spi_write16_blocking (SPI_IF, &a, 1);
    gpio_put (SPI_CS2n_PIN, 1);

    if (++sin_phase >= 100) {
        sin_phase = 0;
    }

    critical_section_enter_blocking (&scale_critsec);
    dac0B = 128+scaleDac0*sine[sin_phase];
    dac1B = 128+scaleDac1*sine[sin_phase];
    dac2B = 128+scaleDac2*sine[sin_phase];
    critical_section_exit (&scale_critsec);

    return true;
}
The Updated Digital-to-Synchro Converter Hardware

The assembled D2S board connected to the Raapberry Pi Pico development board via a small adapter board. The adapter board routes the Pico’s SPI bus signals to the D2S board thus eliminating many jumper wires and increasing the reliability of the setup.
This is my second attempt at a digital-to-synchro converter. The first converter worked but it was spread across four boards connected with dozens of wires and was very inconvenient to use. The updated converter consists of only two boards. The first board is an adapter board that routes the Pico dev board’s SPI bus to the second board. The second board is the D2S board containing the DACs, op amps, and passives.
The two boards connect using a right angle header and header socket without the use of jumper wires. A photo of the two boards connected together is shown above. The smaller purple board under the Pico dev board is the adapter board and the larger black board is the D2S board with the analog components. The Pico is on a separate board in case I wanted to use an FPGA or different microcontroller to drive the D2S board in the future.
The Pico Dev Board Adapter
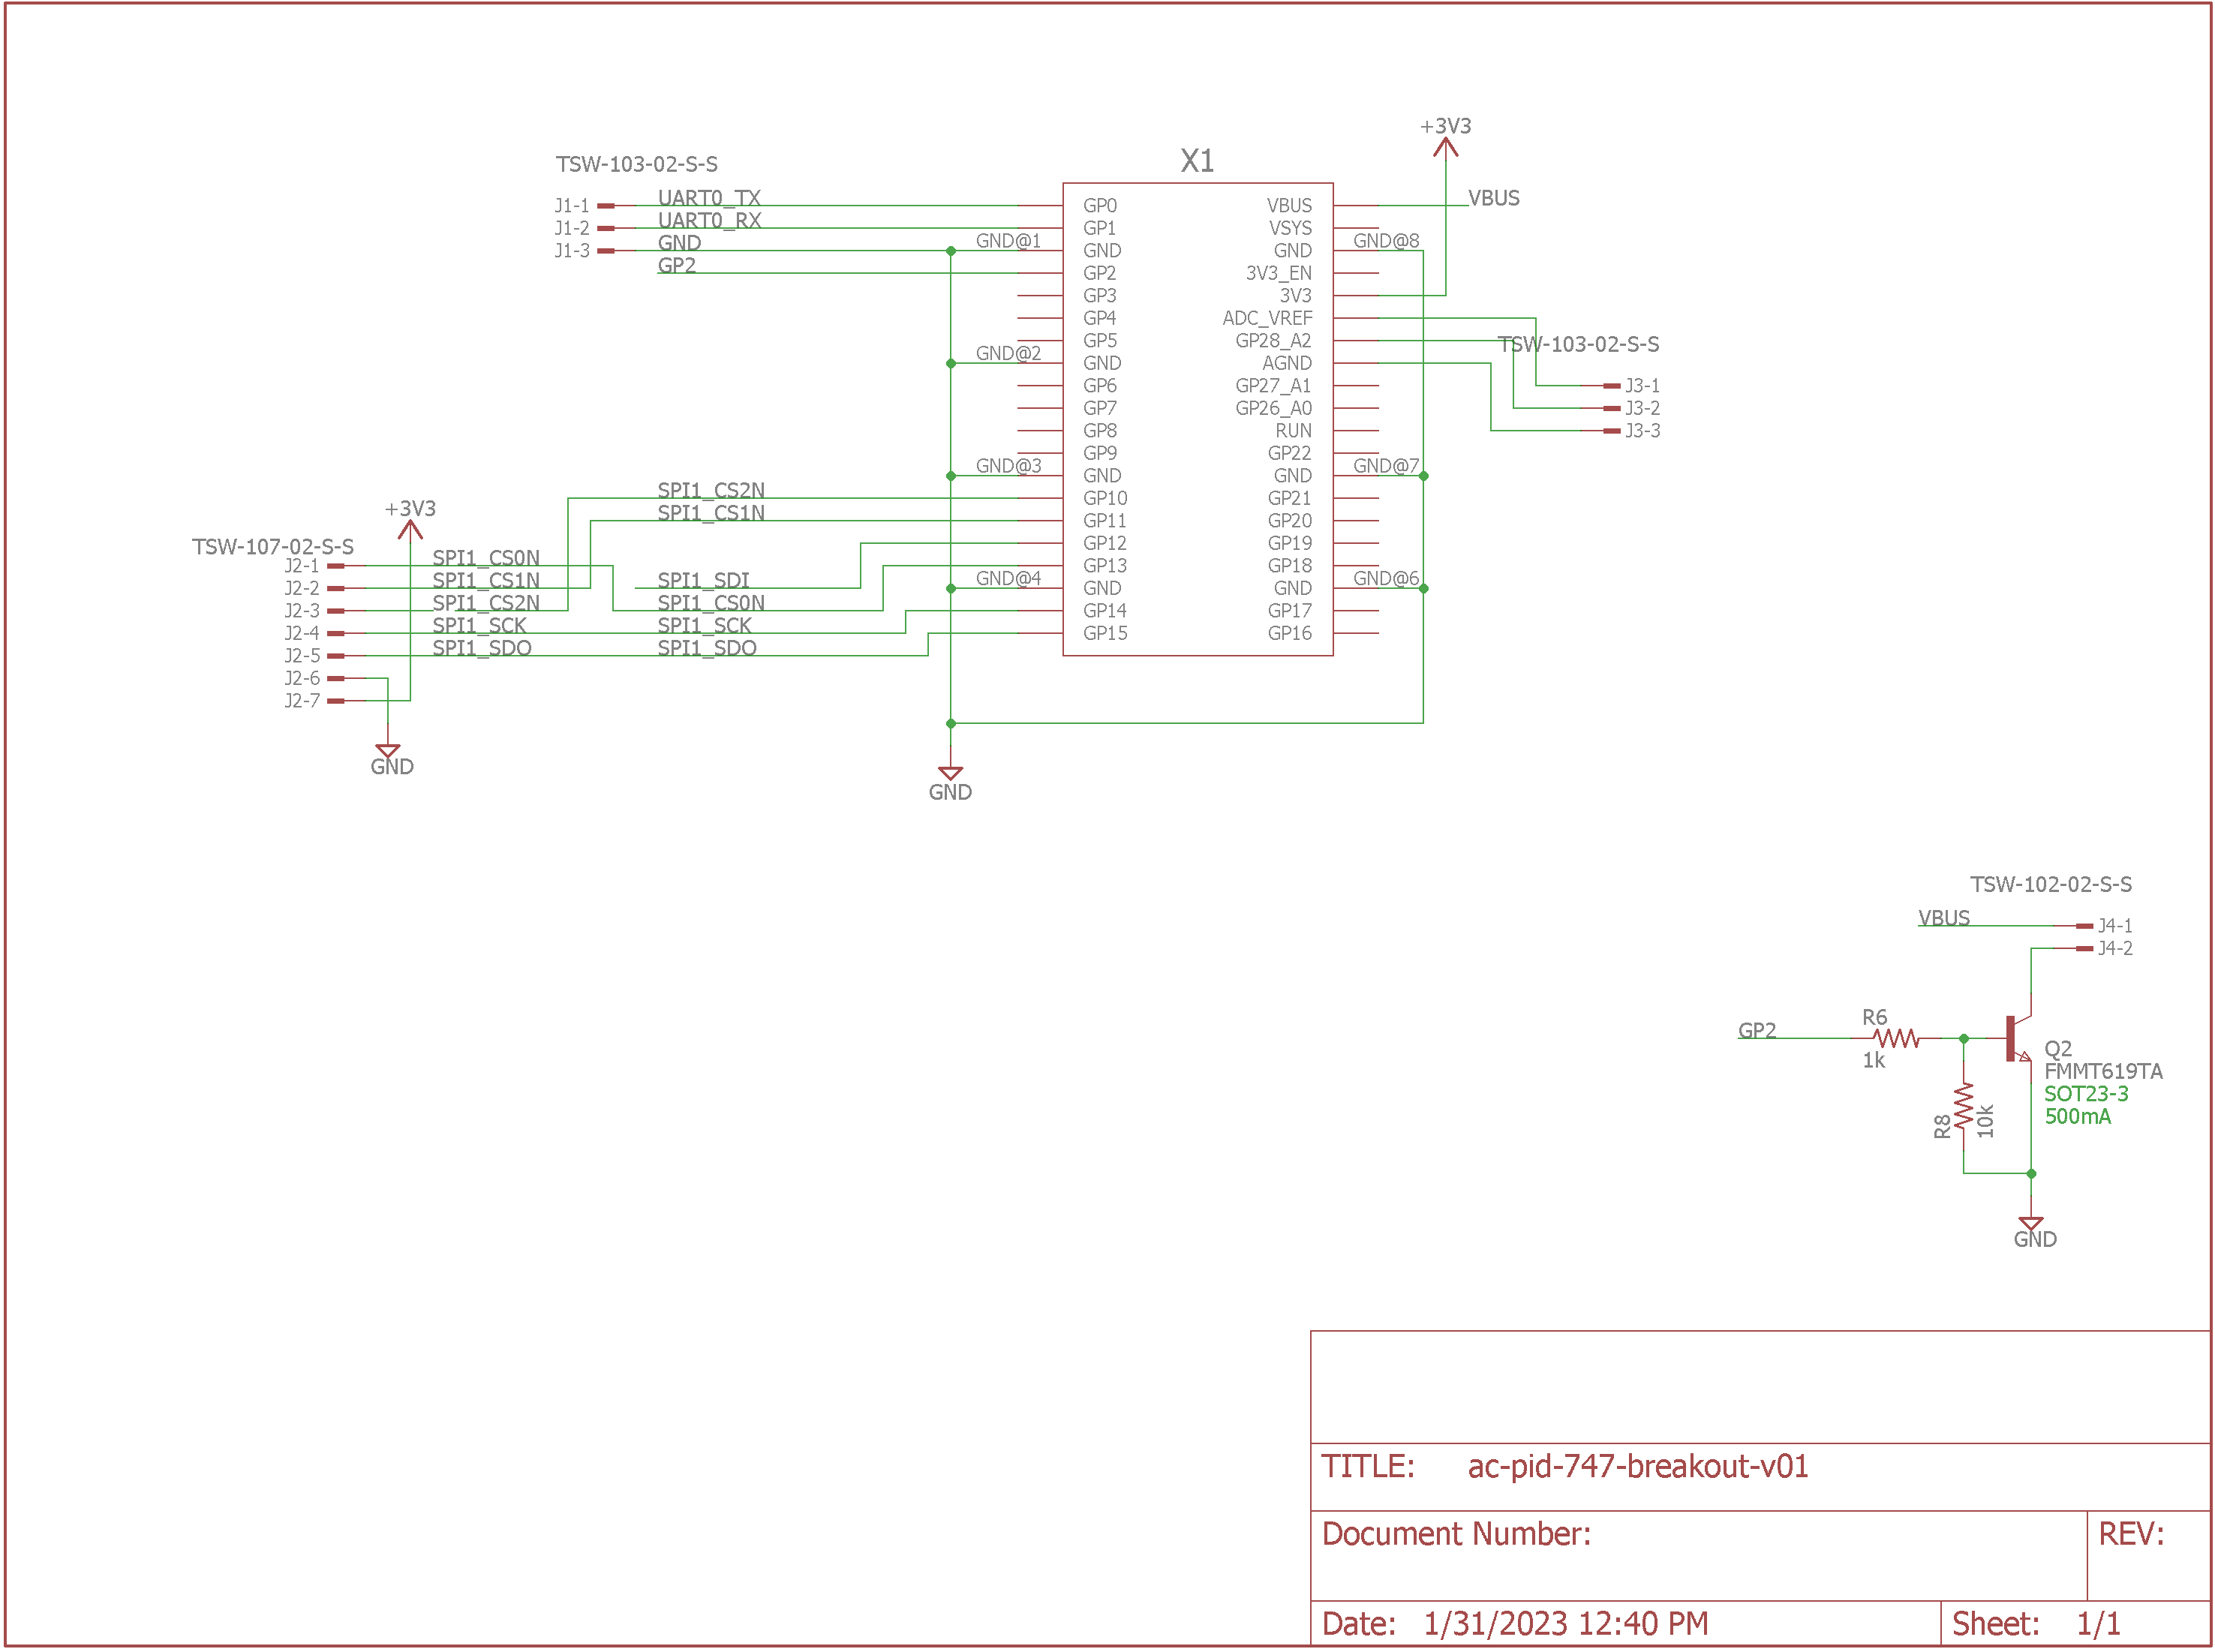
Schematic of the Raspberry Pi Pico development board adapter.
Rather than have a bunch of jumper wires running from the Pico to the D2S board, I built a small adapter board that connects the SPI bus and three chip selects from the Pico to the D2S board. The schematic is shown above. The ADC and transistor switch connections are not used on this project.
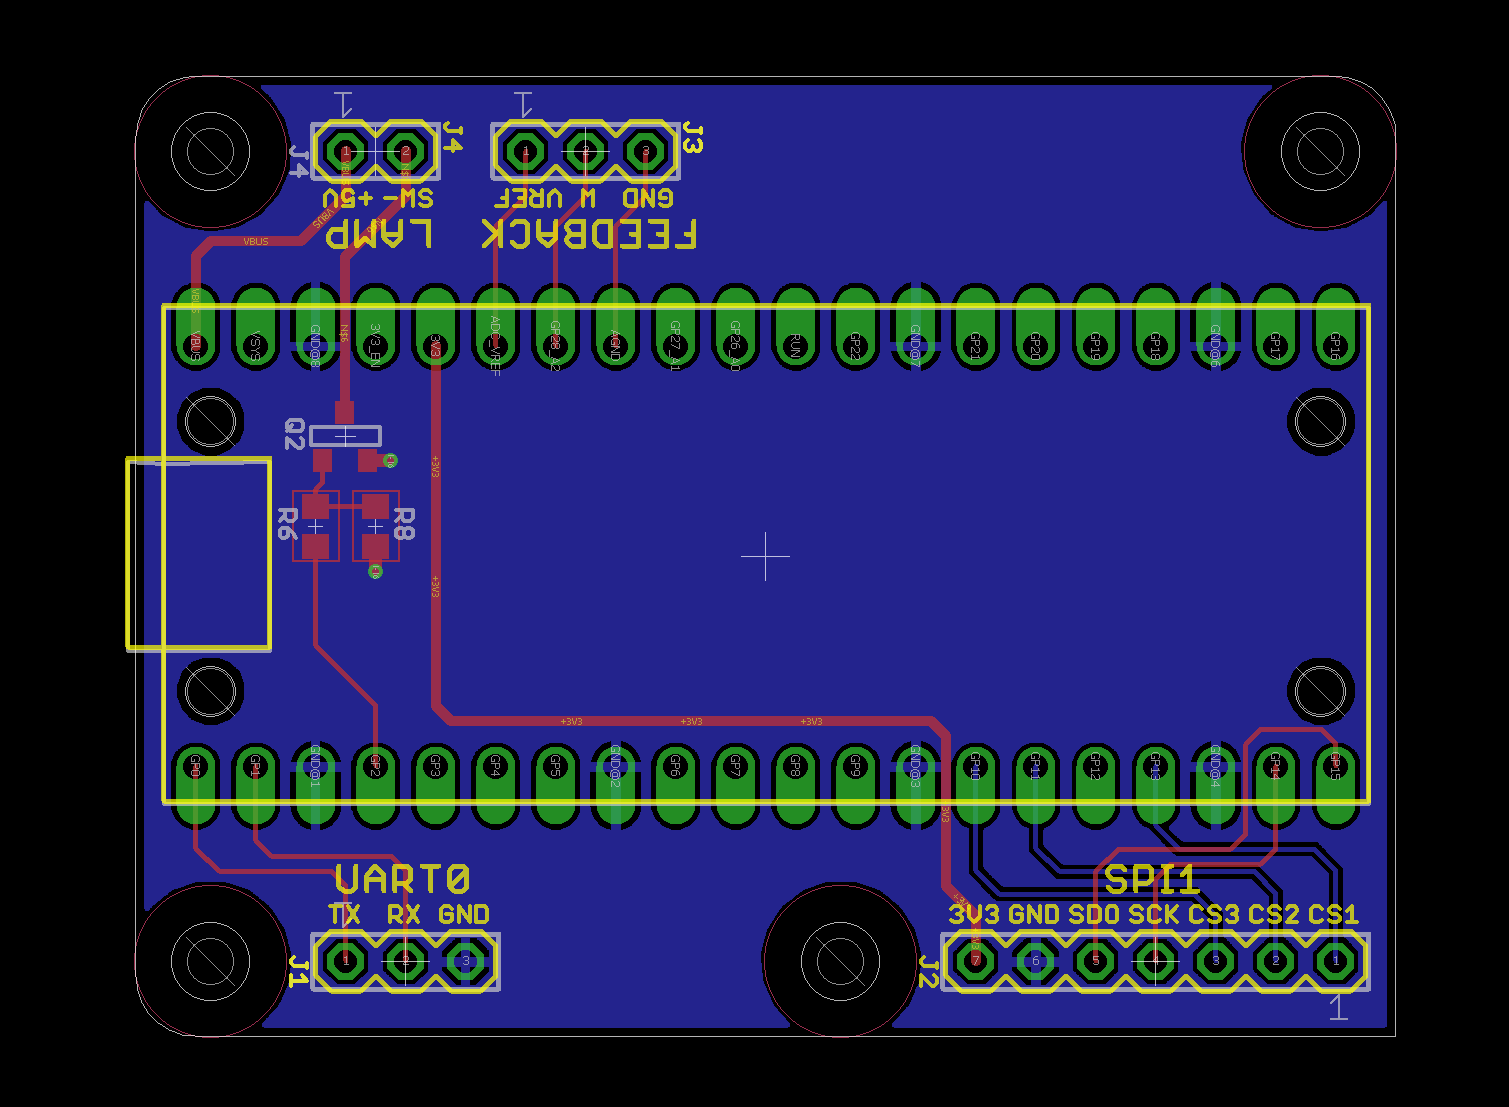
The completed adapter board layout.
The completed board layout is shown above. The feedback and lamp connections are not used on this project.
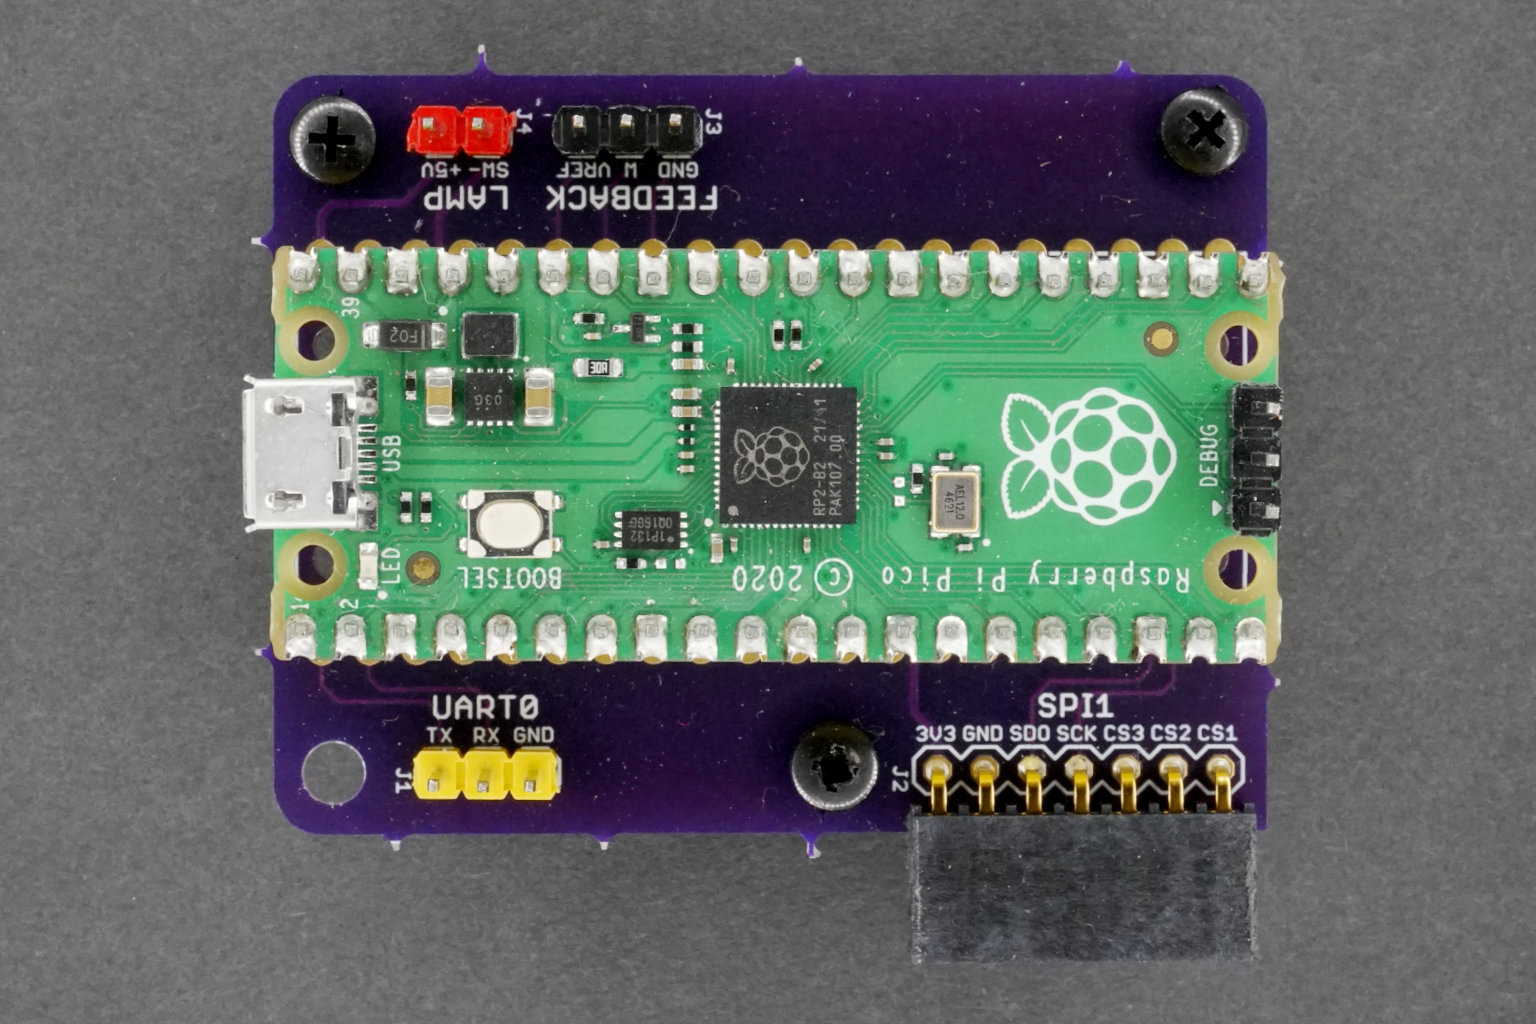
The assembled Pico adapter board.
The adapter board connects to the D2S board using a seven position right angle header socket. Using the adapter board is more reliable and easier to disconnect, move, and reconnect than using a bunch of jumper wires.
Digital-to-Synchro Board Schematic – Page 1

Schematic page 1. R3 and R4 are 261k 1% for an output voltage of about 18.5 VAC RMS. This is the main AC power supply for connected devices.
The digital-to-synchro board contains three output channels that are identical other than the gain of their op amps. The schematic for the first of the three output channels is shown above. This page also contains the power input and power filtering components.
For the first channel, R3 = R4 = 261 kΩ and R1 = R2 = 10.0 kΩ for a voltage gain of 26.1.
The 8-bit MCP4802 DAC has a reference voltage of 2.048 V and an internal gain of 1 when running at 3.3 V. At count 1, the DAC outputs 0.008 V and at count 255, the DAC outputs 2.040 V. Supplying a full-scale sine wave from channel B of the DAC with this voltage range to a non-inverting amplifier with a gain of 26.1 would result in a 53.035 VPP sine wave but from +0.2088 V to +53.244 V.
To remove the DC offset, channel A of the DAC is set to mid scale and used as a reference voltage. The reference voltage is applied to the inverting terminal of the op amp and offsets the sine wave downward by the value of the voltage multiplied by the gain. Mid scale is 128 and results in a 1.024 V reference voltage. With the gain applied, this results in a shift of -26.726 V and the sine wave centered on ground from -26.518 V to +26.518 V.
This is a peak-to-peak output of 53.036 V with a DC offset of 0 V. This is comfortably within the output range of the OPA548 op amp when it is powered from a split 56 V supply and 18.751 VAC RMS is sufficient to power the 26 VAC servo motor inside the altitude indicator.
Simulation of the Op Amp Circuit
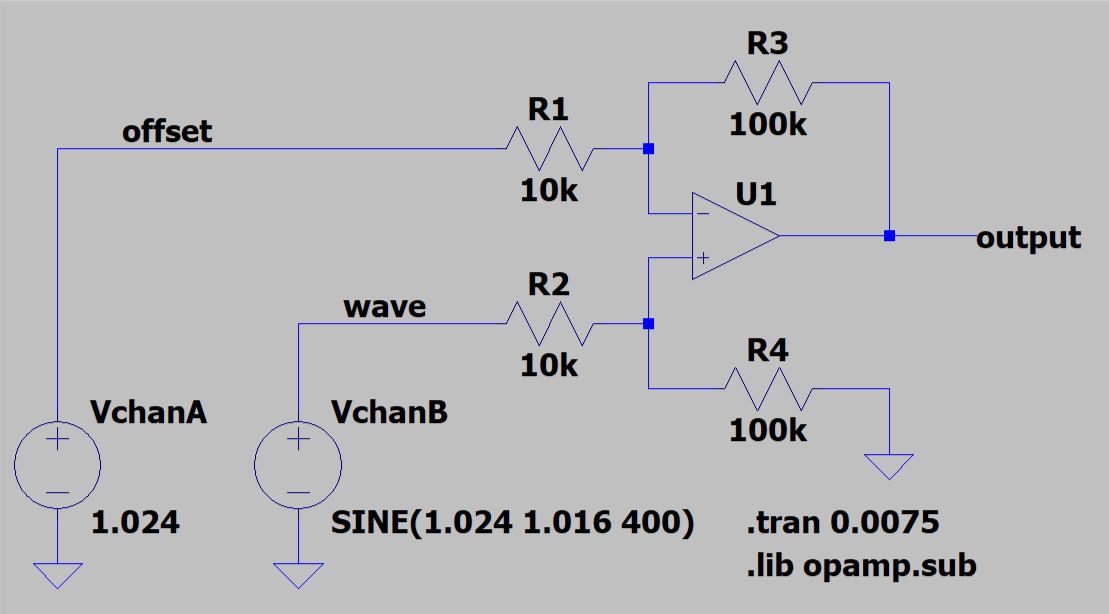
DAC and op amp simulation circuit.
To check the math and design of the DAC and op amp circuit, I ran a simulation of this circuit in LTSpice with R3 = R4 = 100 kΩ and R1 = R2 = 10.0 kΩ for a voltage gain of 10. The simulation circuit is shown above.
The reference voltage source, VchanA, is a constant 1.024 V. The 400 Hz sine wave voltage source, VchanB, has an offset of 1.024 V, an amplitude of 1.016 V, and extends from 0.008 V to 2.040 V. With these inputs and a gain of 10, the output sine wave should extend from -10.16 V to +10.16 V.
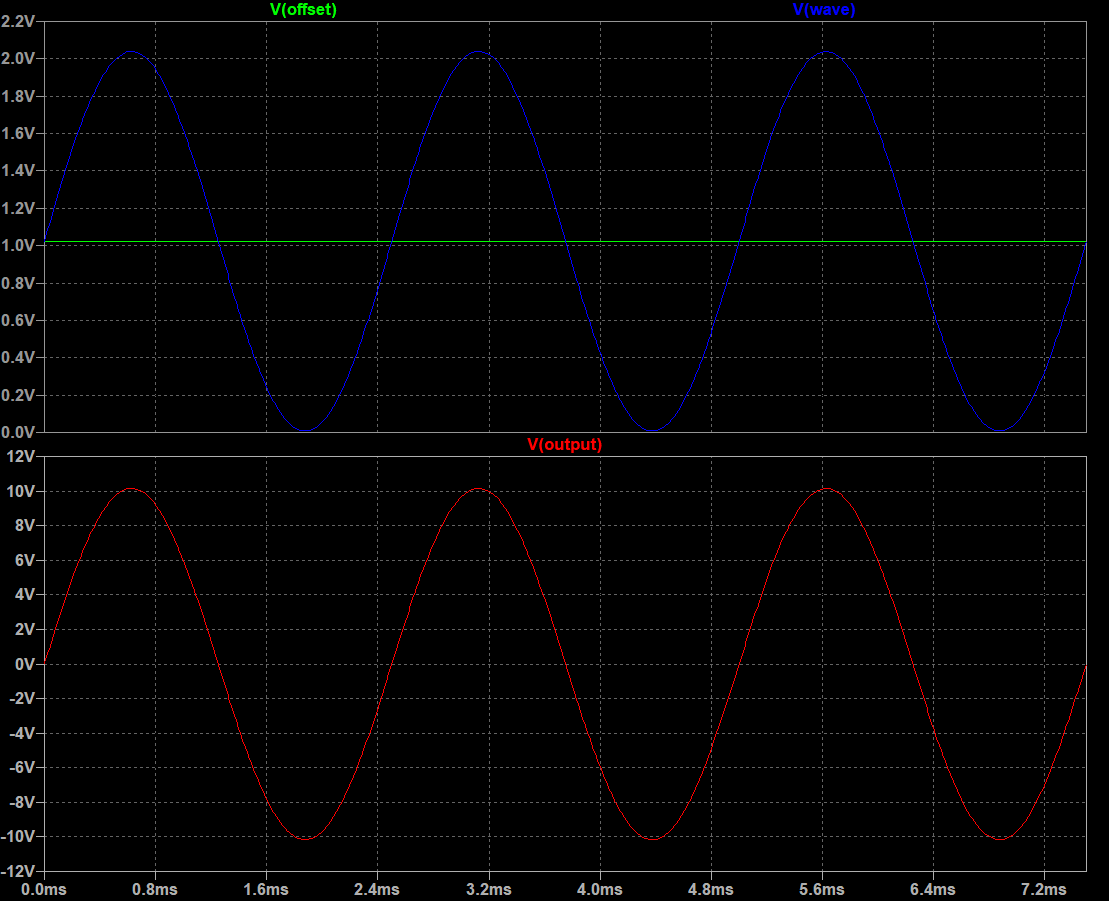
DAC and op amp simulation outputs.
The figure above shows the results of running a transient analysis on the circuit. The top waveform window shows the reference voltage source in green and the sine wave voltage source in blue. These are both positive voltages within the DAC’s output range from 0 V to 2.040 V. The bottom waveform window shows the output voltage in red. The output voltage trace extends from approximately -10 V to +10 V which is the desired output range.
MAX(v(offset))=1.024
MIN(v(offset))=1.024
MAX(v(wave))=2.03889
MIN(v(wave))=0.00800089
MAX(v(output))=10.1469
MIN(v(output))=-10.158
I used the .meas directive in LTSpice to take some measurements from the transient analysis. The measured values are listed above.
Digital-to-Synchro Board Schematic – Page 2

Schematic page 2. R12 and R13 are 120k 1% for an output voltage of about 8.5 VAC RMS. This is one of two supplies used to create the synchro format voltages.
The schematic for the second of the three output channels is shown above. For the second channel, R12 = R13 = 120 kΩ and R10 = R11 = 10.0 kΩ for a voltage gain of 12.0.
This results in a sine wave centered at ground with a positive peak voltage of
(0xff/0x100 ⋅ 2.048) ⋅ R13/R10 – (0x80/0x100 ⋅ 2.048) ⋅ R12/R11 =
2.040 V ⋅ 120 kΩ / 10 kΩ – 1.024 V ⋅ 120 kΩ / 10 kΩ = +12.192 V
and a negative peak voltage of
(0x01/0x100 ⋅ 2.048) ⋅ R13/R10 – (0x80/0x100 ⋅ 2.048) ⋅ R12/R11 =
0.008 V ⋅ 120 kΩ / 10 kΩ – 1.024 V ⋅ 120 kΩ / 10 kΩ = -12.192 V
This is a peak-to-peak output of 24.384 V with a DC offset of 0 V. This is comfortably within the output range of the OPA548 op amp when it is powered from a split 56 V supply and 8.621 VAC RMS is sufficient to power the control transformer inside the altitude indicator.
Digital-to-Synchro Board Schematic – Page 3
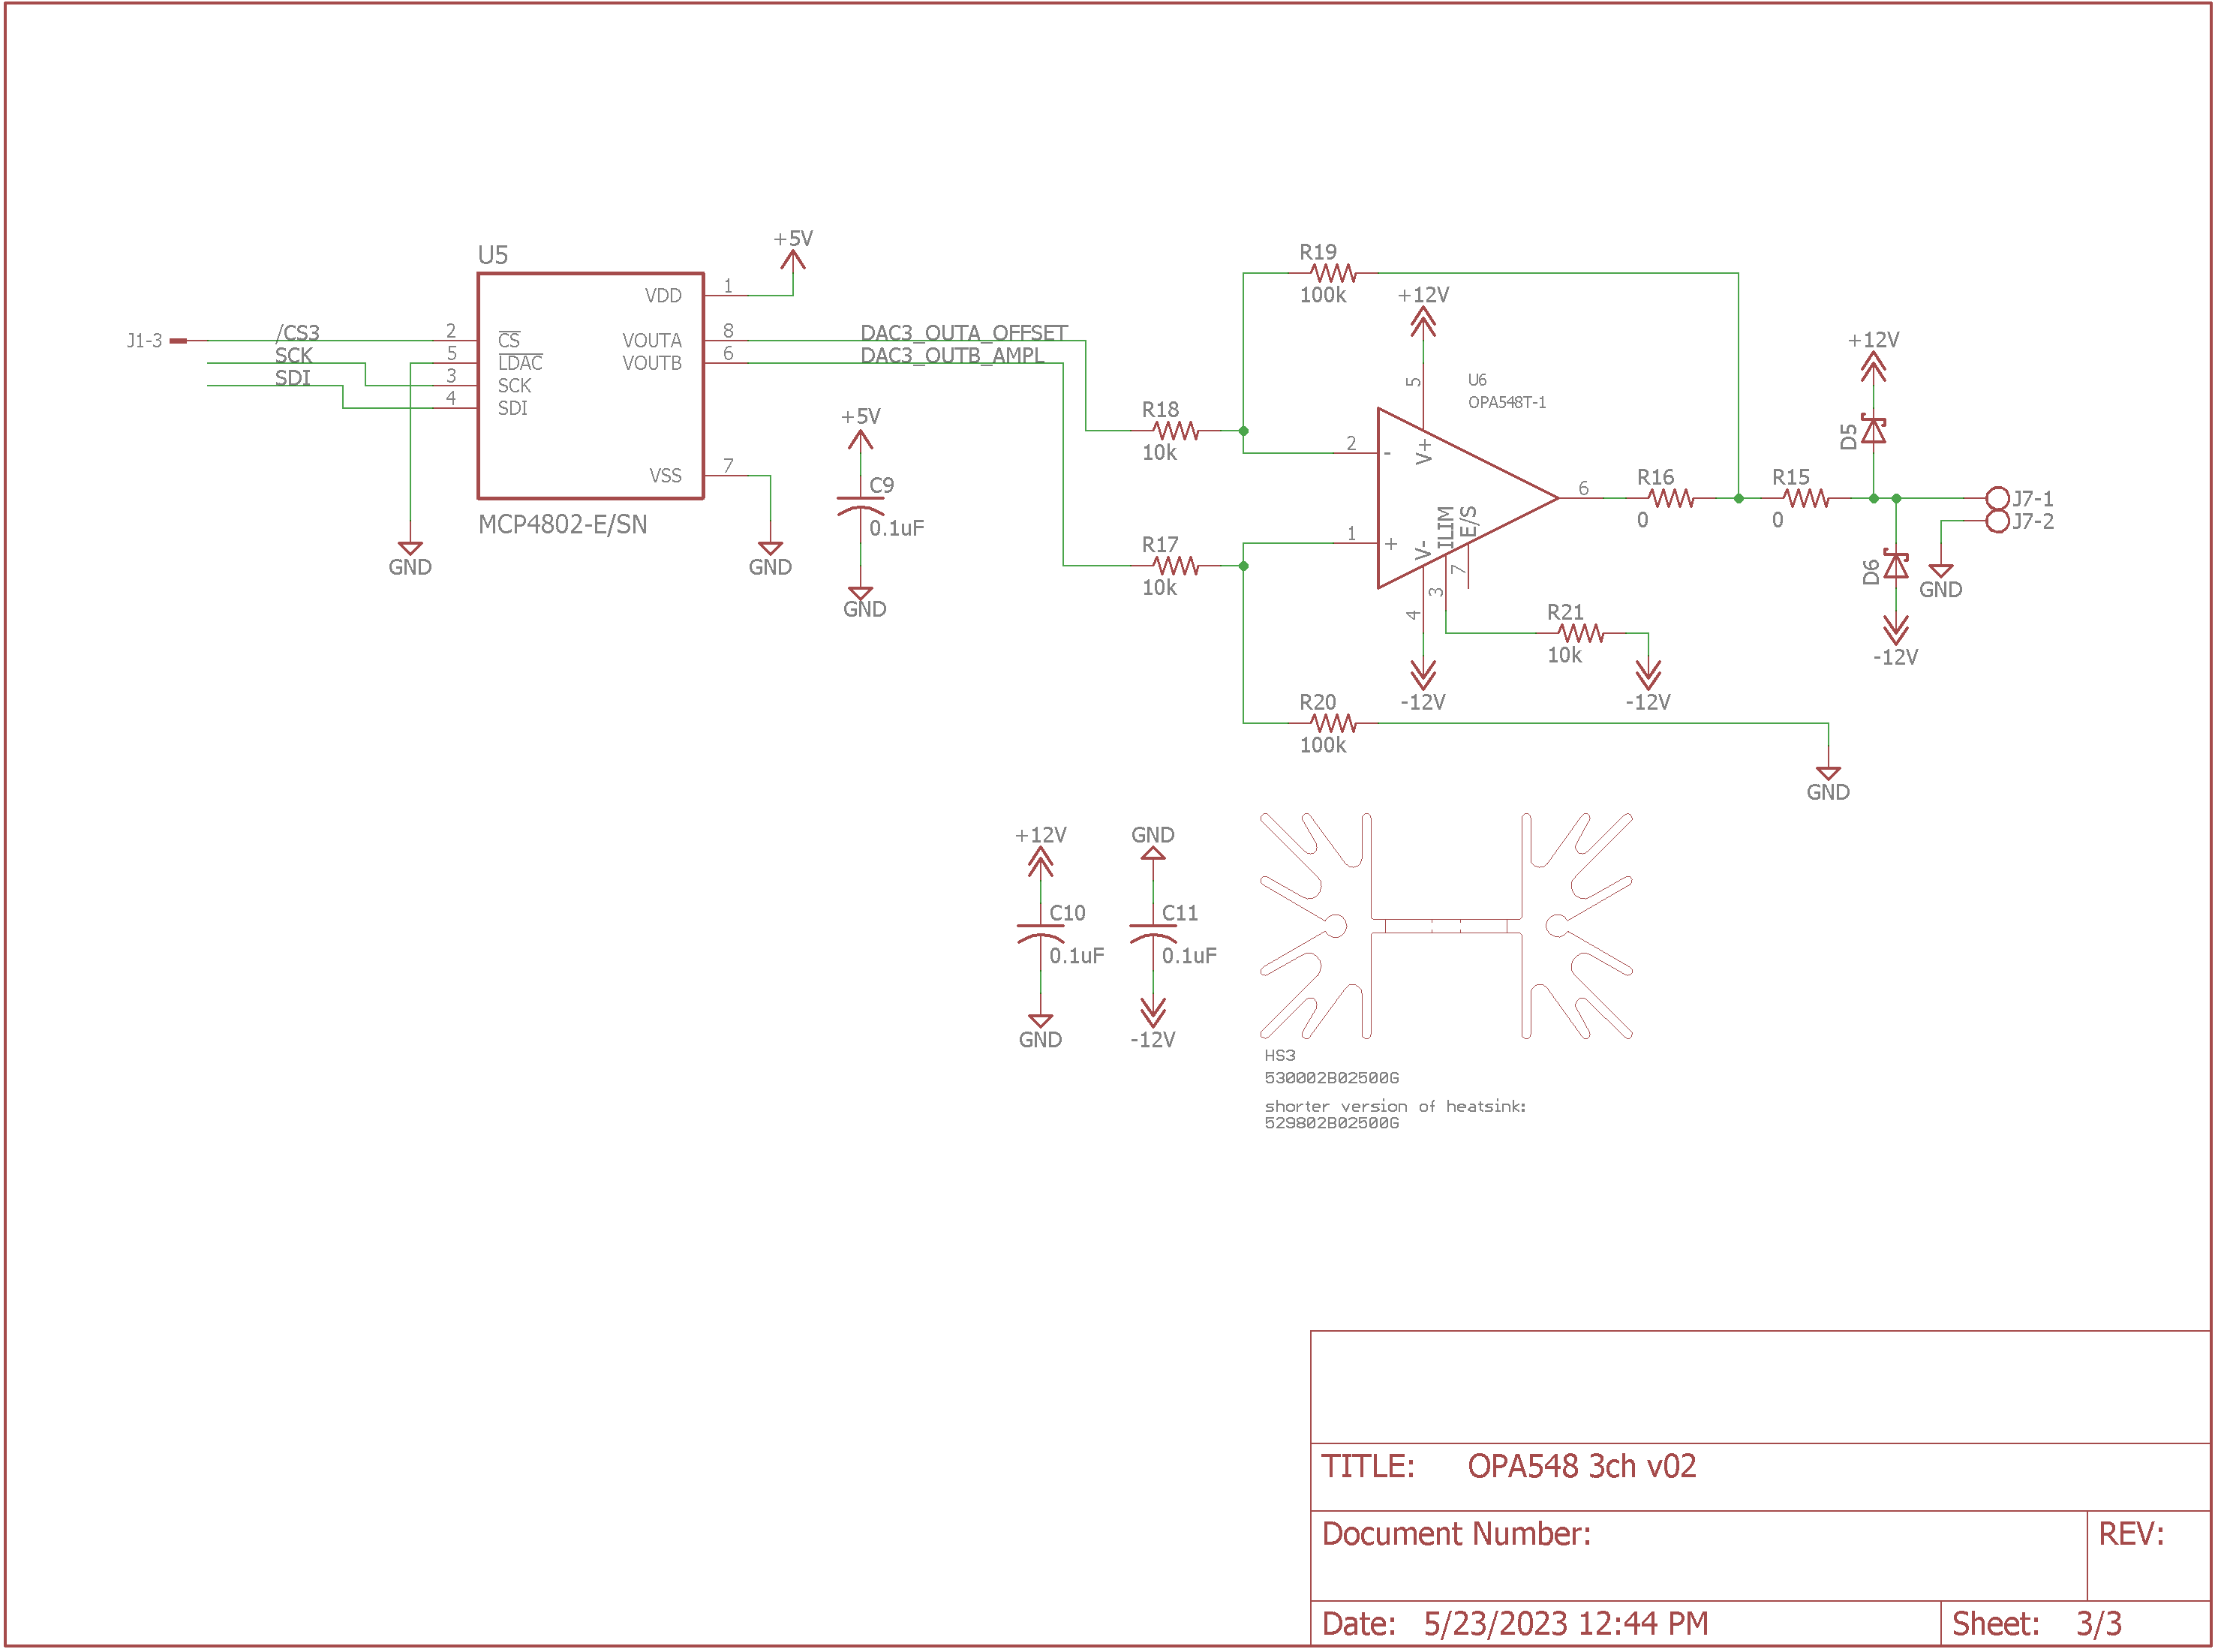
Schematic page 3. R19 and R20 are 120k 1% for an output voltage of about 8.5 VAC RMS. This is the second of two supplies used to create the synchro format voltages.
The schematic for the last of the three output channels is shown above. For the third channel, R19 = R20 = 120 kΩ and R17 = R18 = 10.0 kΩ for a voltage gain of 12.0. Since the gain is the same as for channel 2, the peak positive and peak negative voltages are the same as well: +12.192 V and -12.192 V.
This is a peak-to-peak output of 24.384 V with a DC offset of 0 V. This is comfortably within the output range of the OPA548 op amp when it is powered from a split 56 V supply and 8.621 VAC RMS is sufficient to power the control transformer inside the altitude indicator.
Board Layout
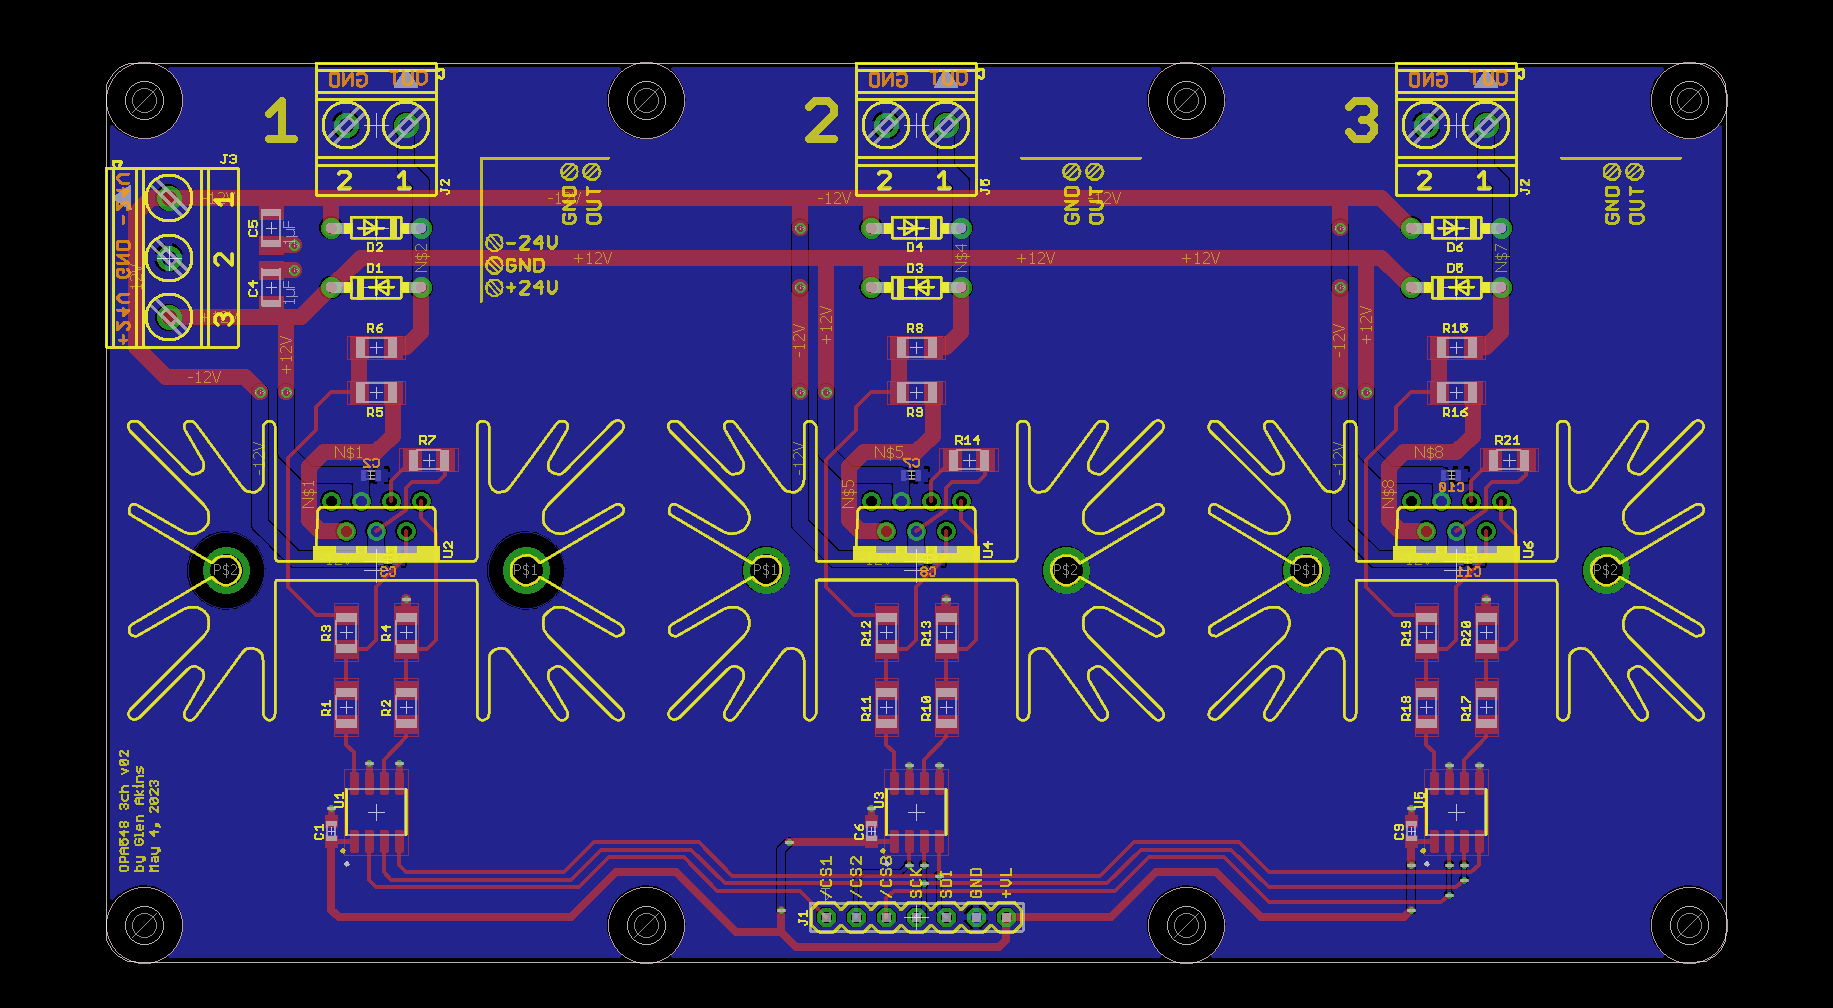
The completed digital-to-synchro converter board layout.
The completed board layout is shown in the image above. Output channels 1 to 3 are arranged left to right across the top edge of the board, the split power supply input is at the top of left edge, and the right angle header connector for the SPI bus is centered along the bottom edge. R3, R4, R12, R13, R19, and R20 are located fairly deep within the outside perimeters of the heatsinks but it is possible with a bit of care to change them to change the gain of the output channels.
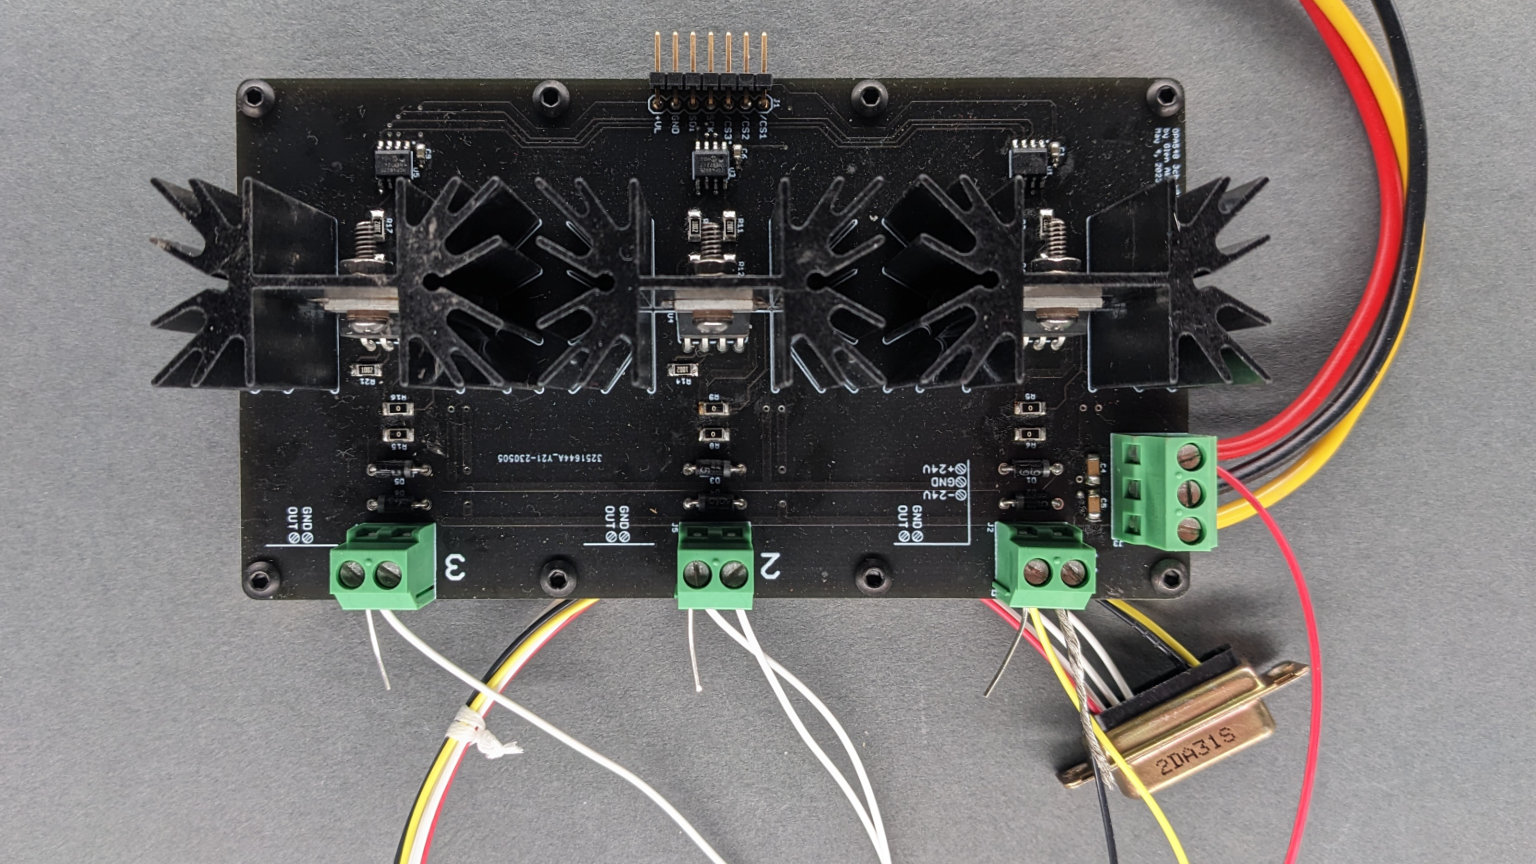
The assembled DAC and op amp board. The exposed wires in the terminal blocks are for scope probes.
The assembled board is shown in the photo above. Wires from the green Phoenix terminal blocks will connect to a bench DC power supply and the altitude indicator. The channel 1 connections supply 400 Hz power to the servo motor inside the indicator. The channel 2 and 3 connections supply the 400 Hz synchro format control signal to the indicator.
The Altitude Indicator
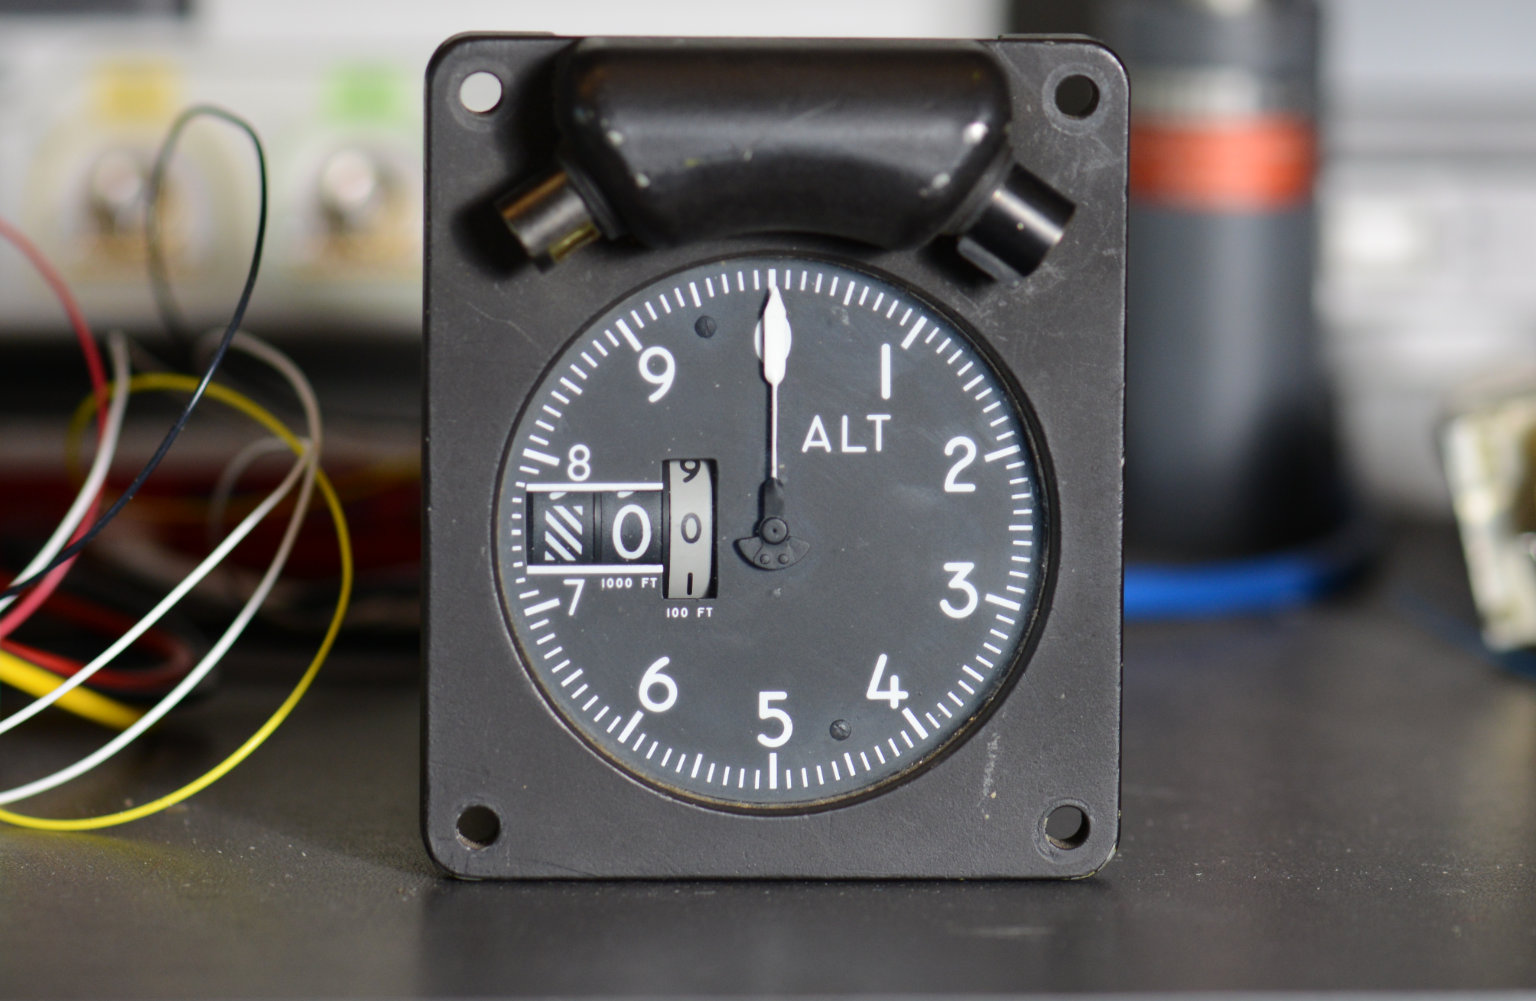
Front view of the altitude indicator on my workbench.
The front of the altitude indicator is shown in the photo above. The front has a large dial and pointer with a smaller mechanical drum counter inset in the dial. Above the indicator’s glass window is a bulge with two lamps that illuminate the dial and counter at night.
The pointer on the large dial makes one revolution for every 1,000 feet of altitude. Each large number is 100 feet and each small tick is 10 feet. The drum counter indicates the aircraft’s altitude in hundreds of feet. The counter’s most-significant digit is the 10,000’s digit, the next digit is the 1,000’s digit, and the final digit in white is the hundred’s digit. A crosshatch in the most-significant digit (as seen in the photo above) indicates a zero and that the aircraft is flying below 10,000 feet.
As an example, if the aircraft were flying at 12,350 feet, the drum counter would read “123” and the pointer would be half way between the “3” and “4” on the dial.
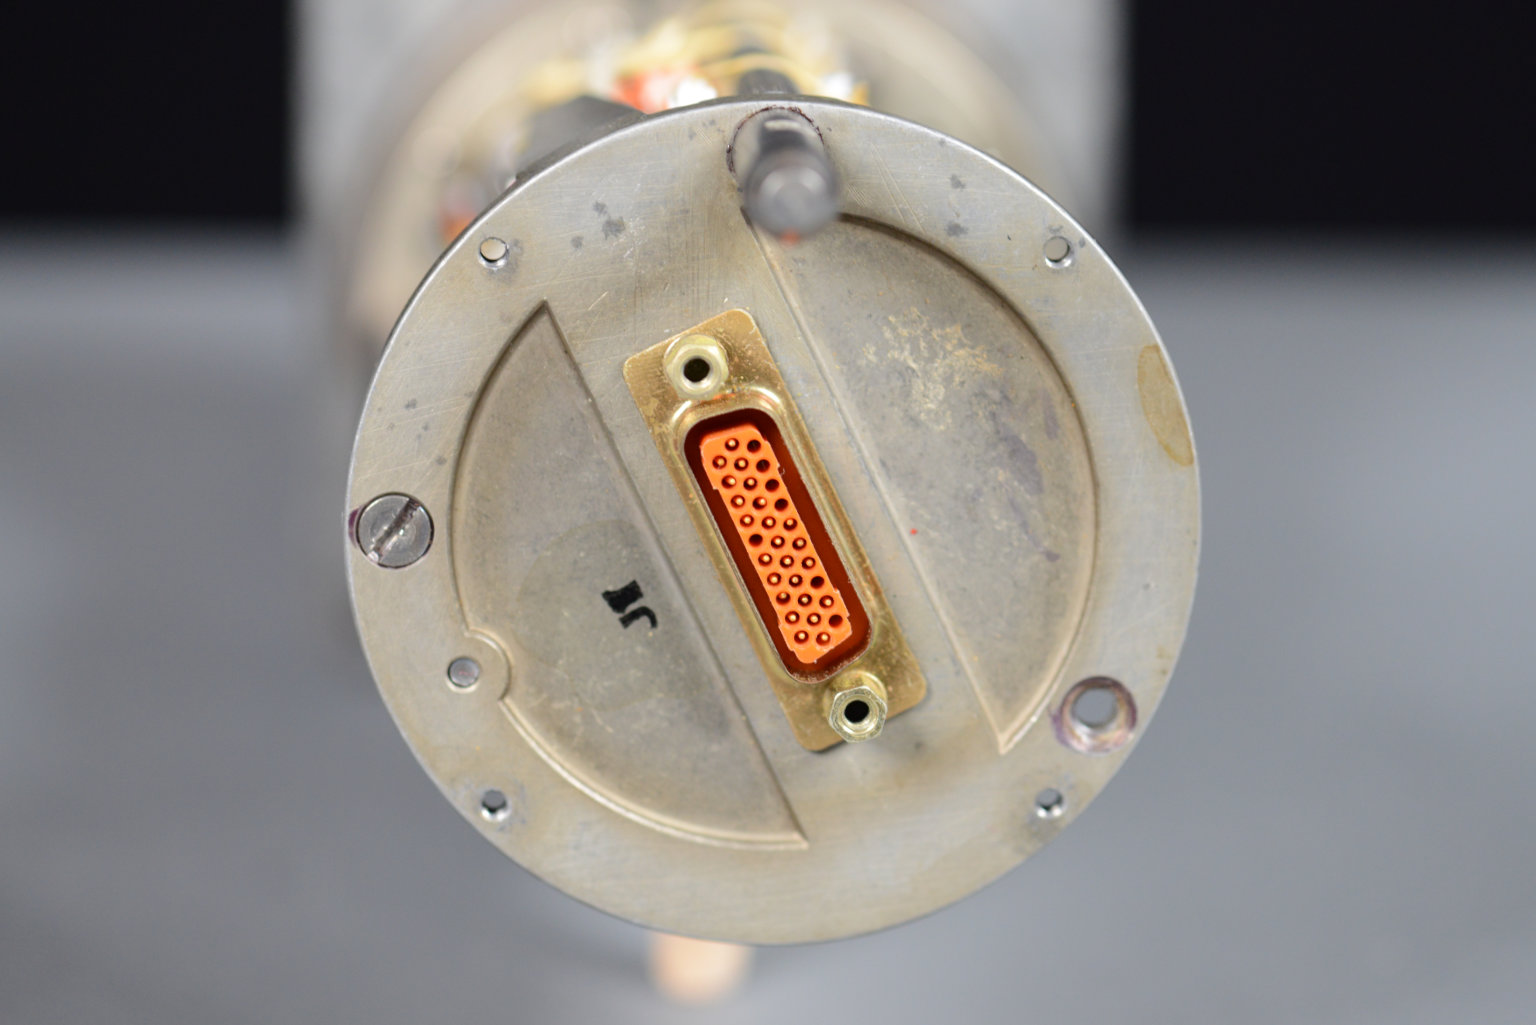
The rear of the indicator with the outer cover removed. Notice anything funny about the D sub connector?
The rear of the unit with the outer housing removed is shown in the photo above. There’s a single ITT Cannon double-density, 31 position, D subminiature connector on the rear. At first glance, it looks like a regular D sub socket but looking closer reveals that inside each hole on the socket connector is a pin contact rather than a socket contact. Ostensibly this is done to protect the thin pins required to achieve this contact density from damage while the much more rugged socket contacts are then exposed in the mating plug connector (shown below).
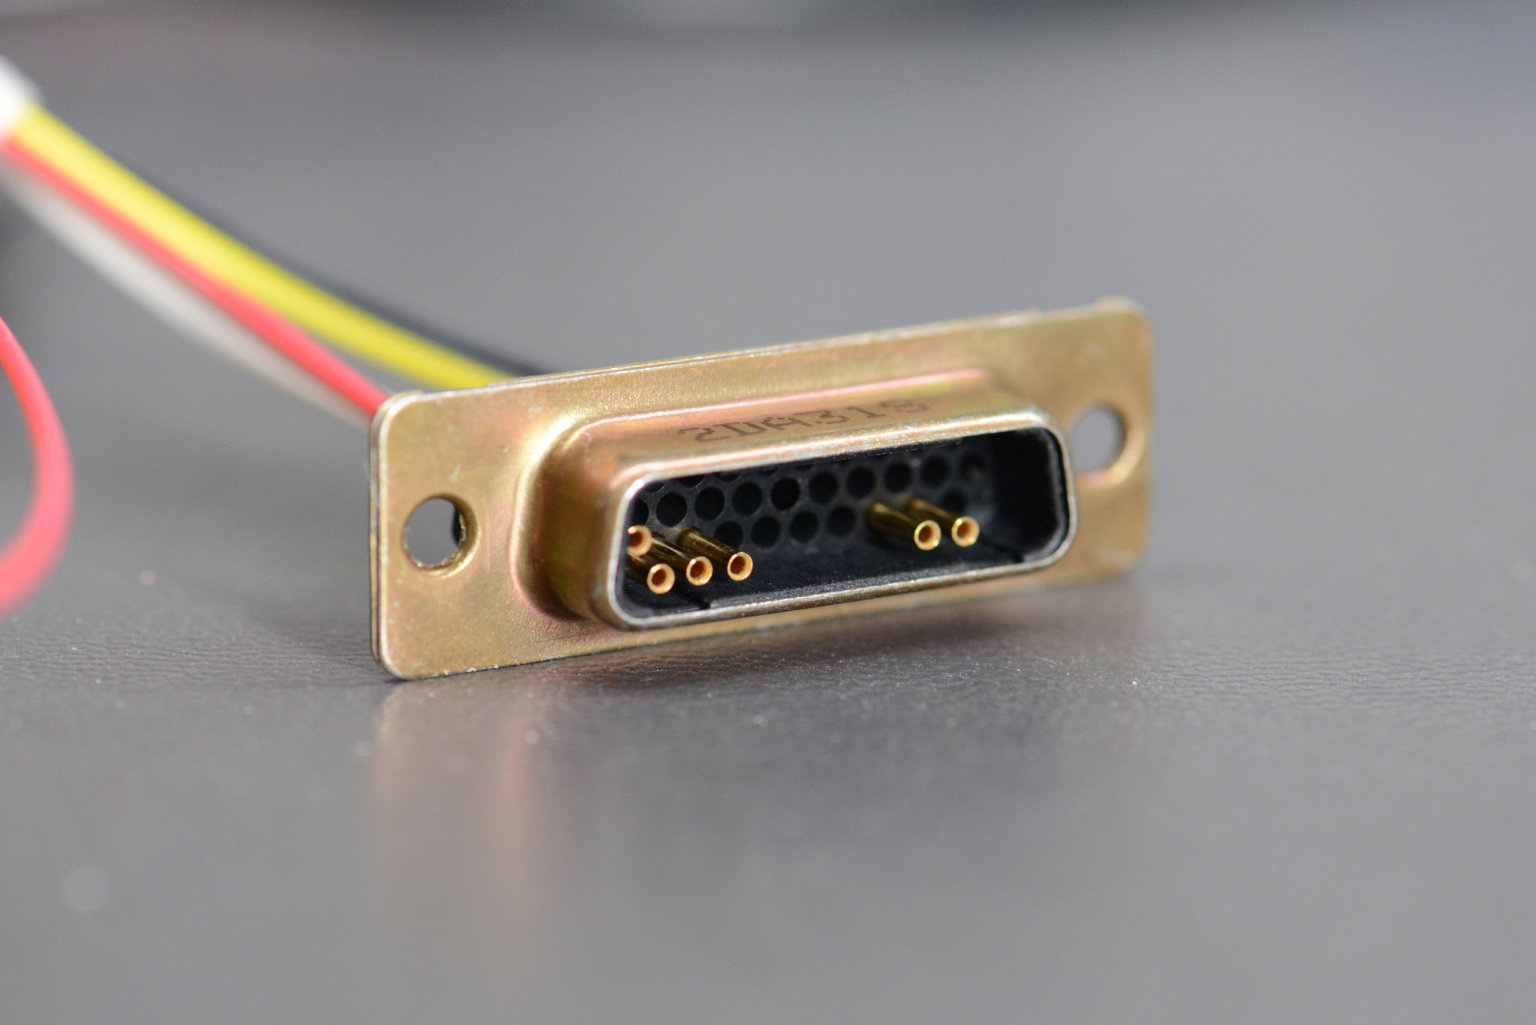
The mating connector and wire harness for powering and controlling the altitude indicator.
The rear panel connector contains connections for AC power, DC power, the synchro control voltage inputs, and a few other signals.
This altitude indicator is not an altimeter. It is a remote indicator for an altimeter located elsewhere in the aircraft. You can tell it’s not an altimeter because it lacks a barometric knob for setting the reference pressure, it lacks a Kollsman window to show the set reference pressure, the rear panel lacks a connection to the aircraft’s static system, and internally, it lacks an aneroid capsule for measuring the altitude.
Internals
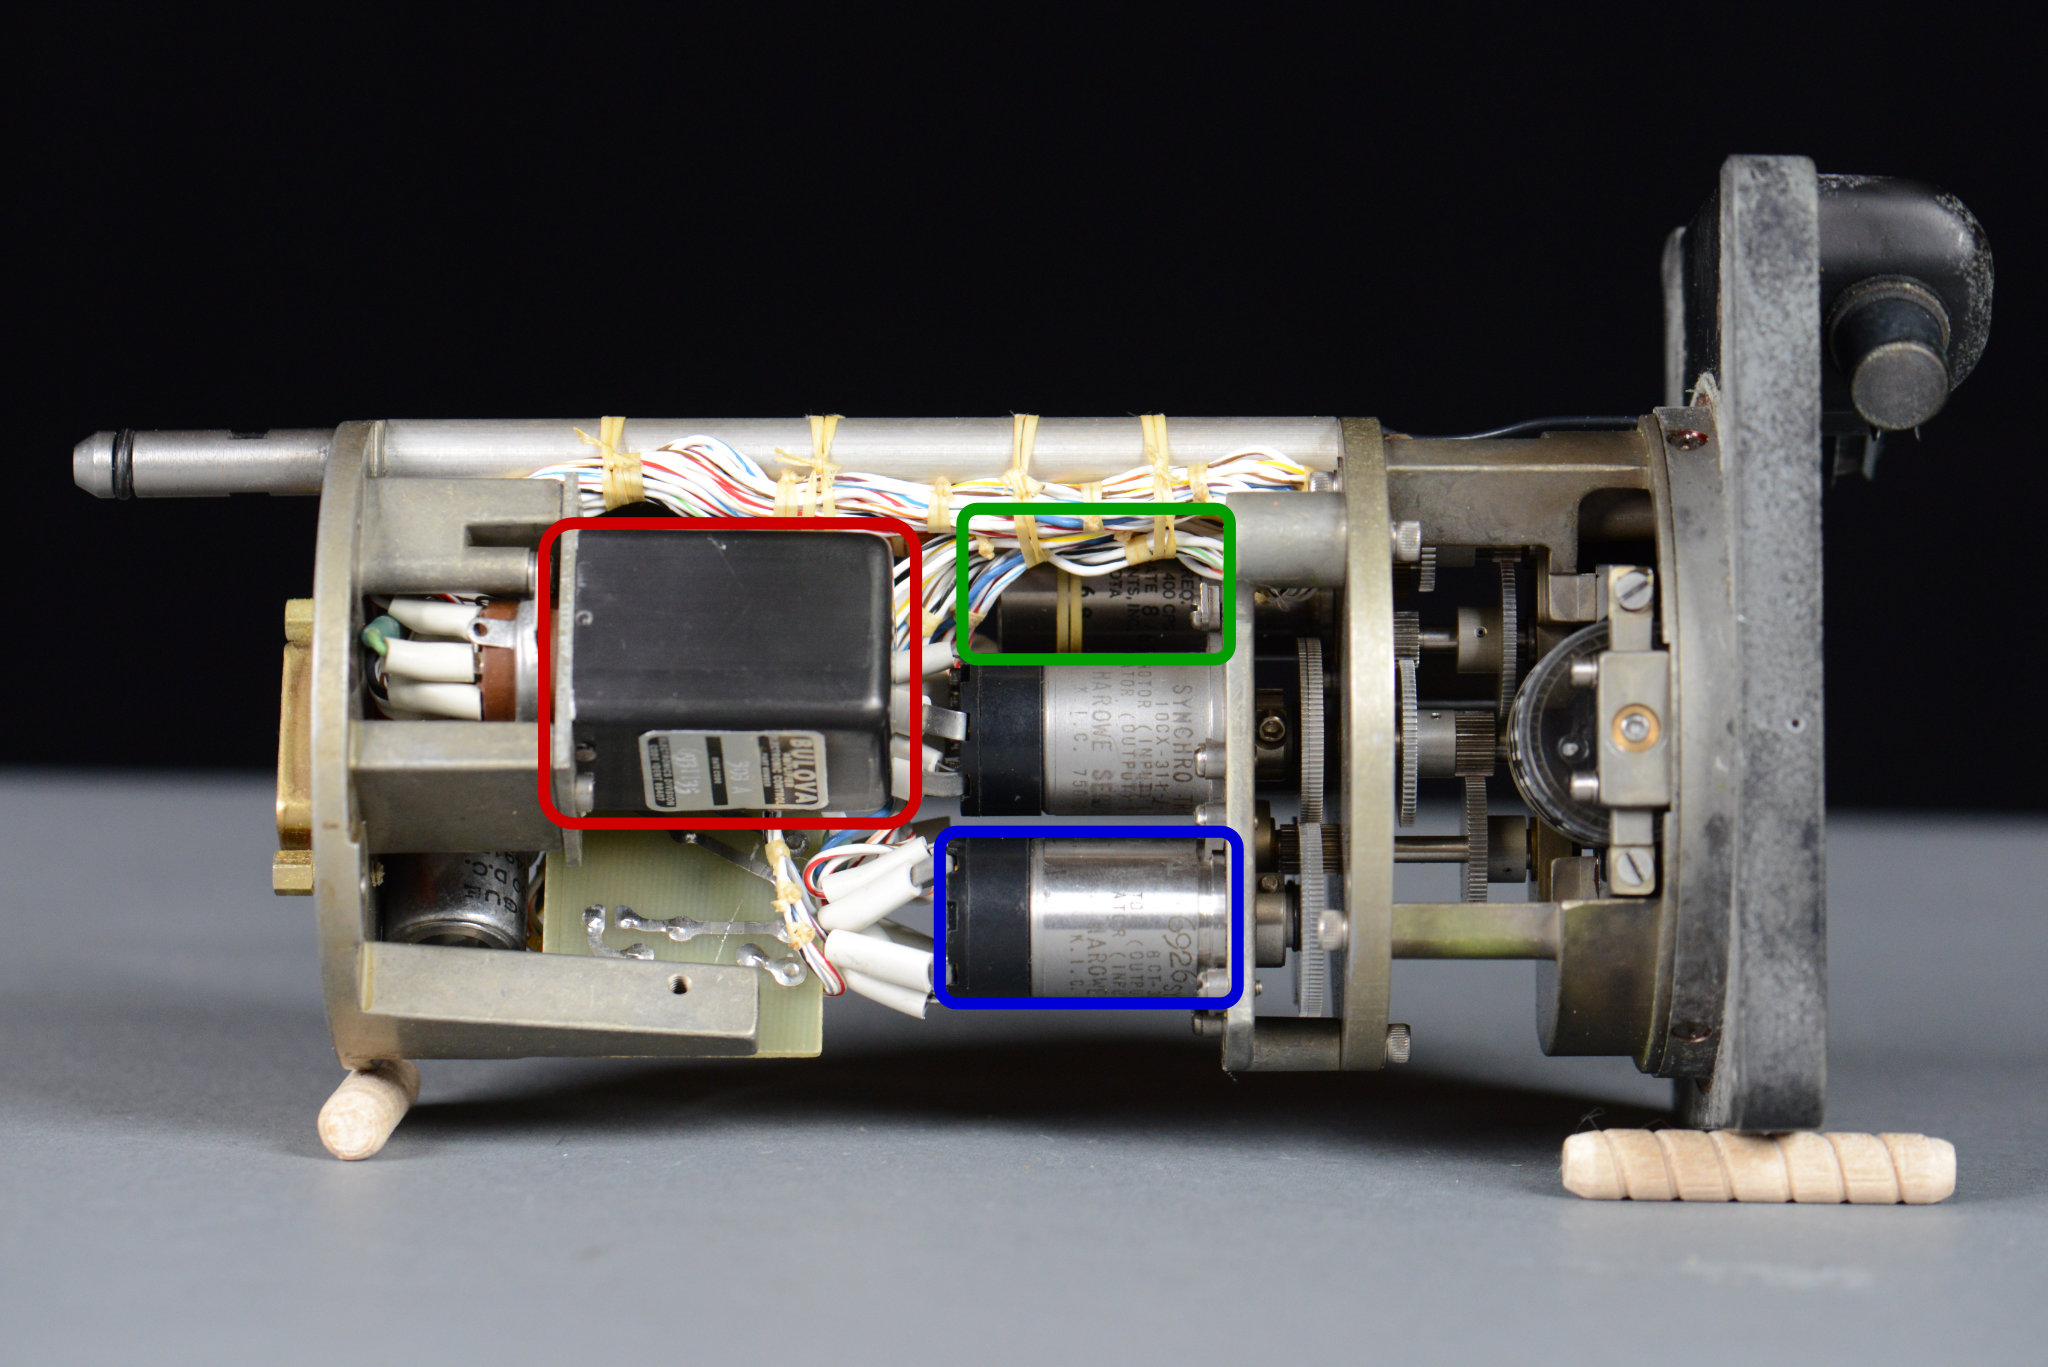
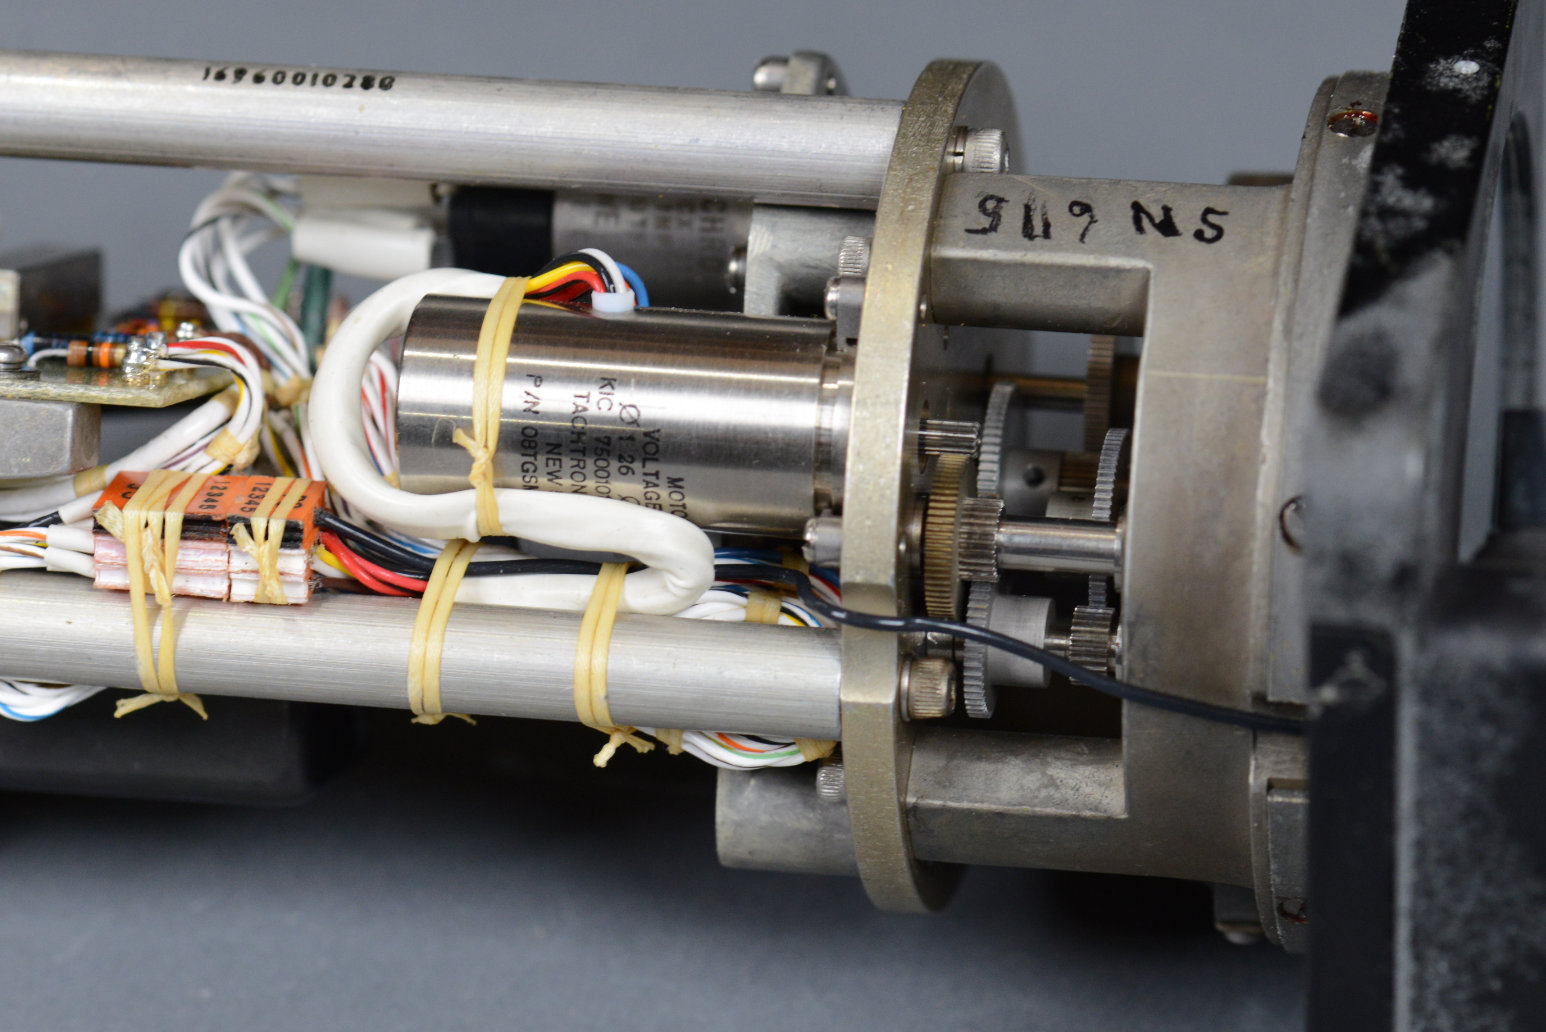
The internals of the altitude indicator. The control transformer is highlighted in blue. The servo motor is highlighted in green. The servo amp is highlighted in red.
The photo above shows the insides of the altitude indicator. It contains a synchro control transformer (blue), an AC servo motor (green), a servo amplifier (red), and two synchro transmitters (not highlighted). These are coupled together and to the dial and drum counter on the front of the indicator using a bunch of gears.
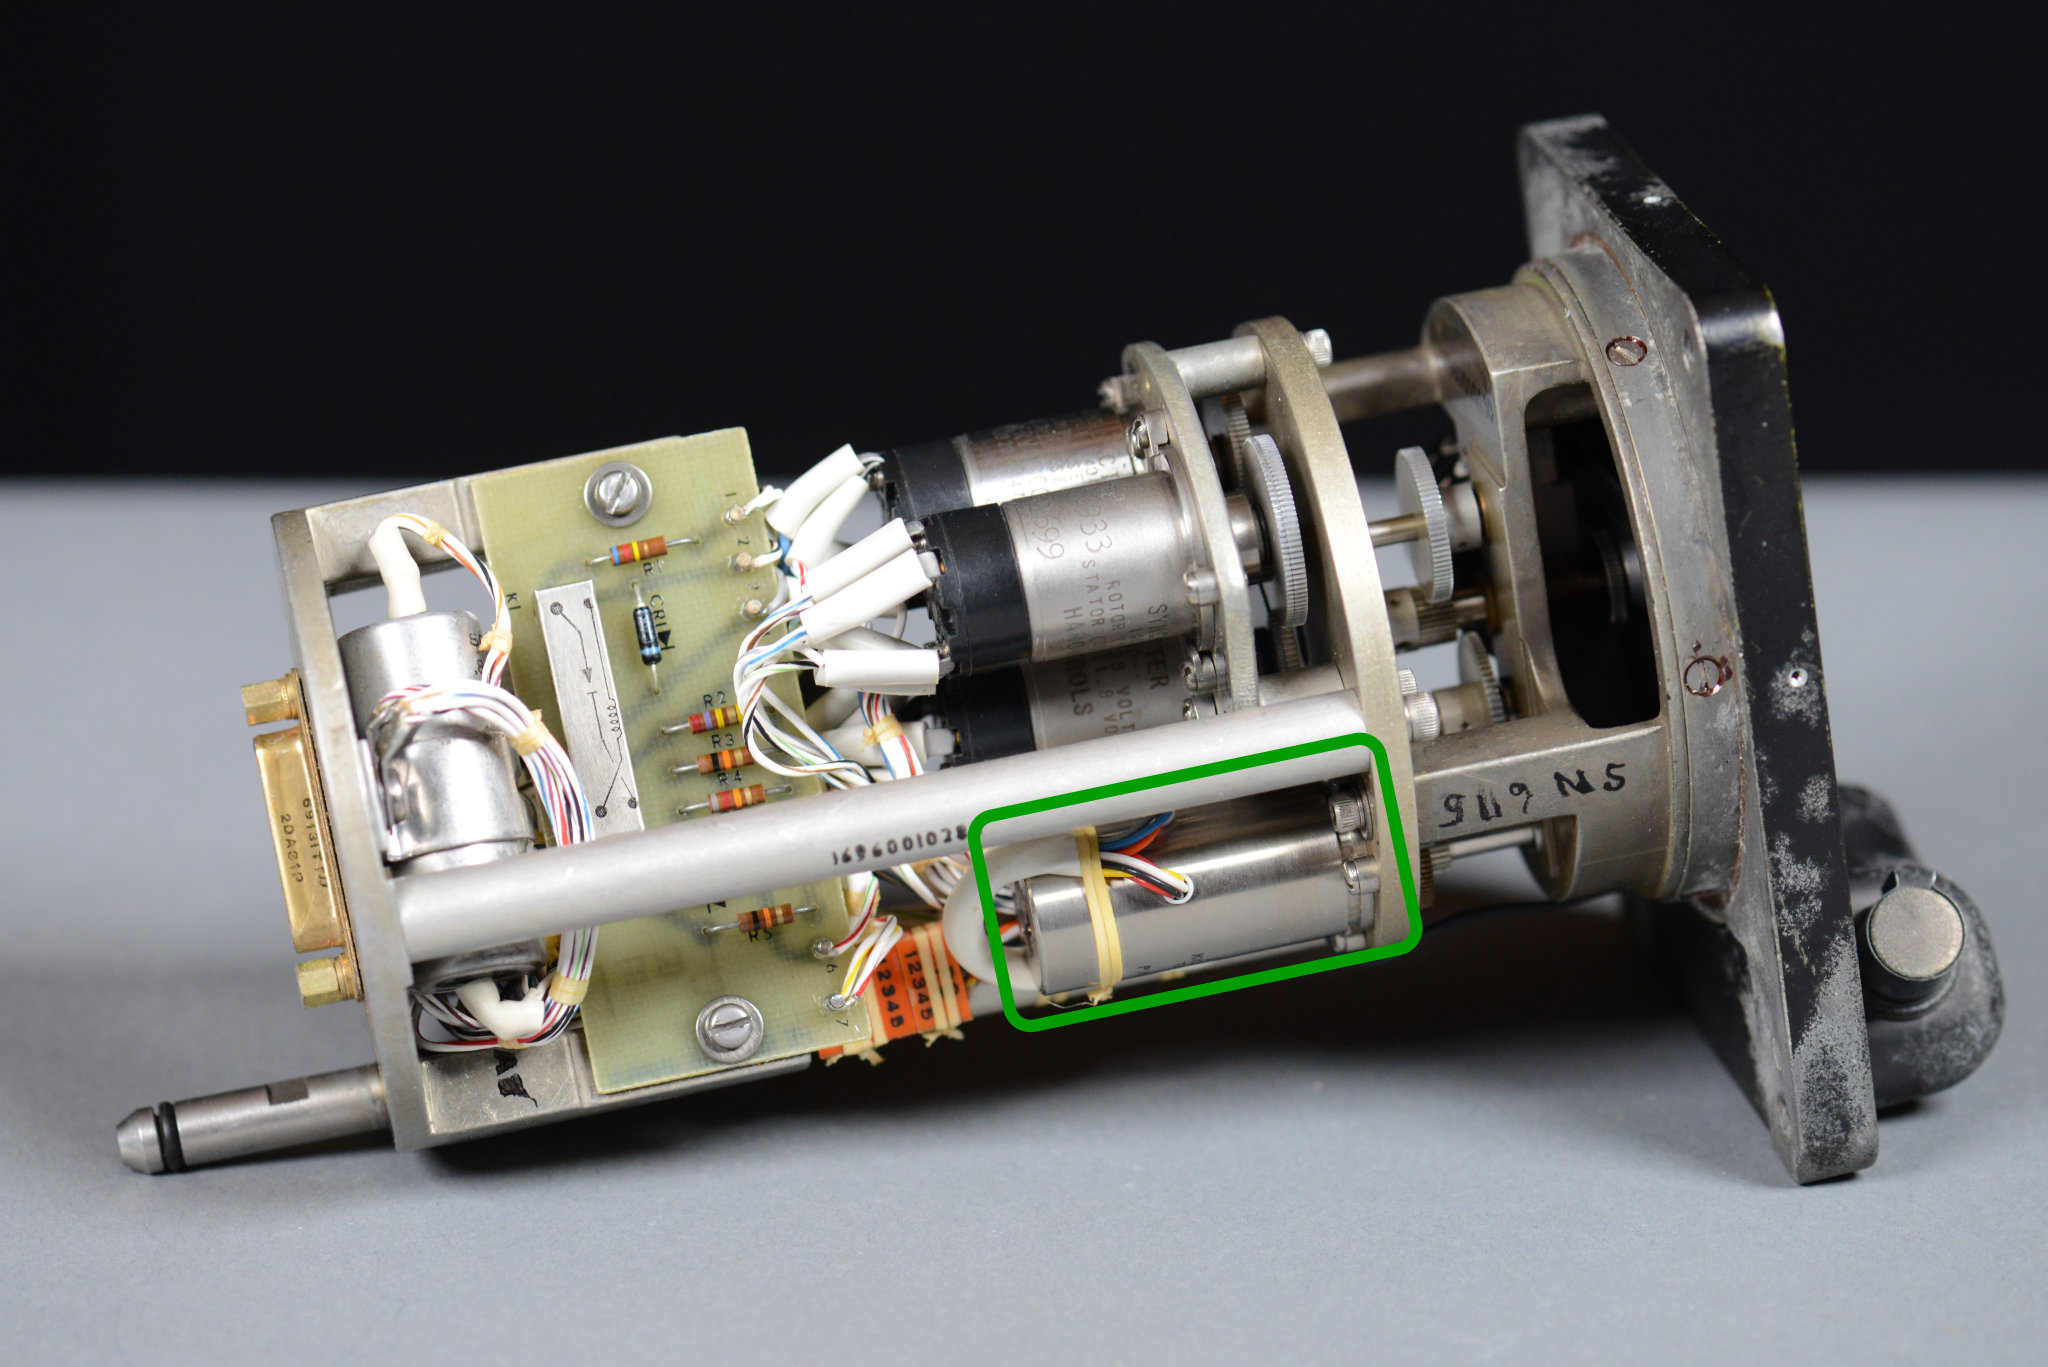
The internals flipped 180° from the previous photo. The servo motor is highlighted in green.
The photo above is another view of the inside of the indicator. The servo motor is highlighted in green. The small circuit board contains a relay for enabling the servo loop and some diodes and passives that are used to scale the error signal.
The control transformer, servo motor, and servo amp form a servo loop that’s used to translate the synchro-format control signals input on the rear connector into a mechanical indication of the altitude on the front of the unit. We’ll talk about each of these three components then how they’re used to position the pointer and set the counter.
Control Transformer
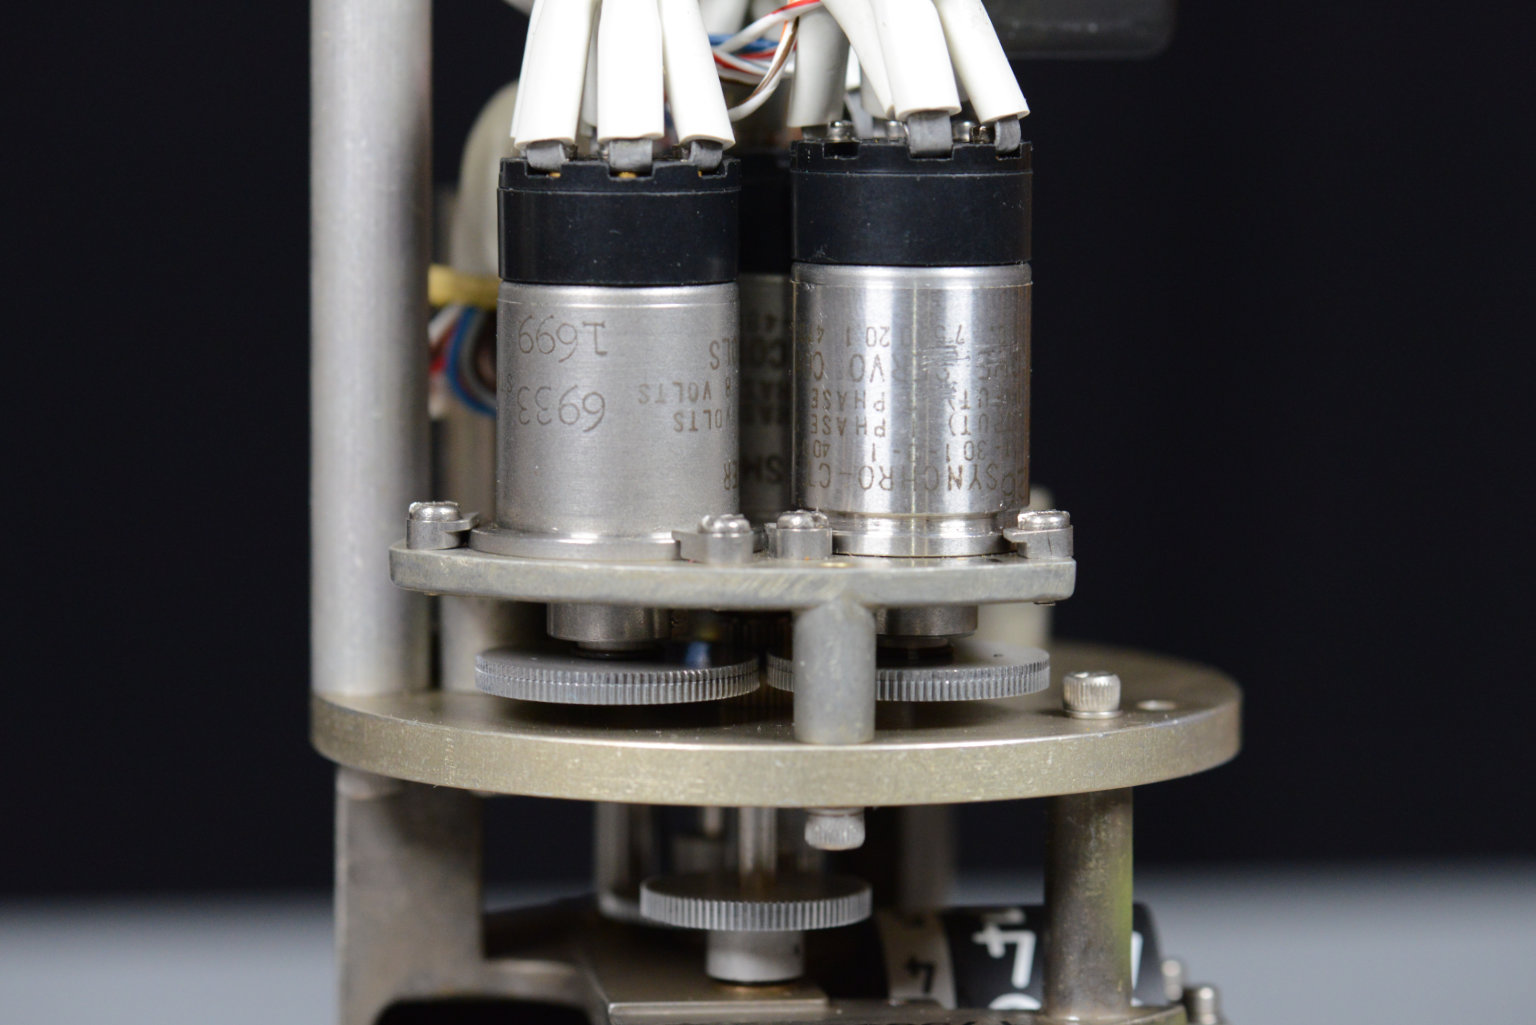
One of two synchro transmitters on left and the control transformer on the right.
The control transformer is the feedback component in an analog synchro-based servo loop. In a more modern system, it’d be replaced with a potentiometer or an absolute encoder.
The control transformer has two inputs and one output. The first input is electrical. It is the control input indicating the desired output angle of the system. The second input is mechanical. It is the feedback input indicating the actual output angle of the system. The output is an error signal indicating the direction and magnitude of the difference between the two angles.
In the altitude indicator, the control input is a synchro-format signal indicating the angle corresponding to the altitude to be displayed on the indicator. This signal comes from the digital-to-synchro converter. The feedback input is the shaft of the control transformer. It is coupled through gears to the pointer and counter and its angle is a function of the currently displayed altitude.
When the control input’s angle is equal to the shaft input’s angle, the error is nulled. This is shown in the figure below where the red scope trace of the error signal is effectively zero.
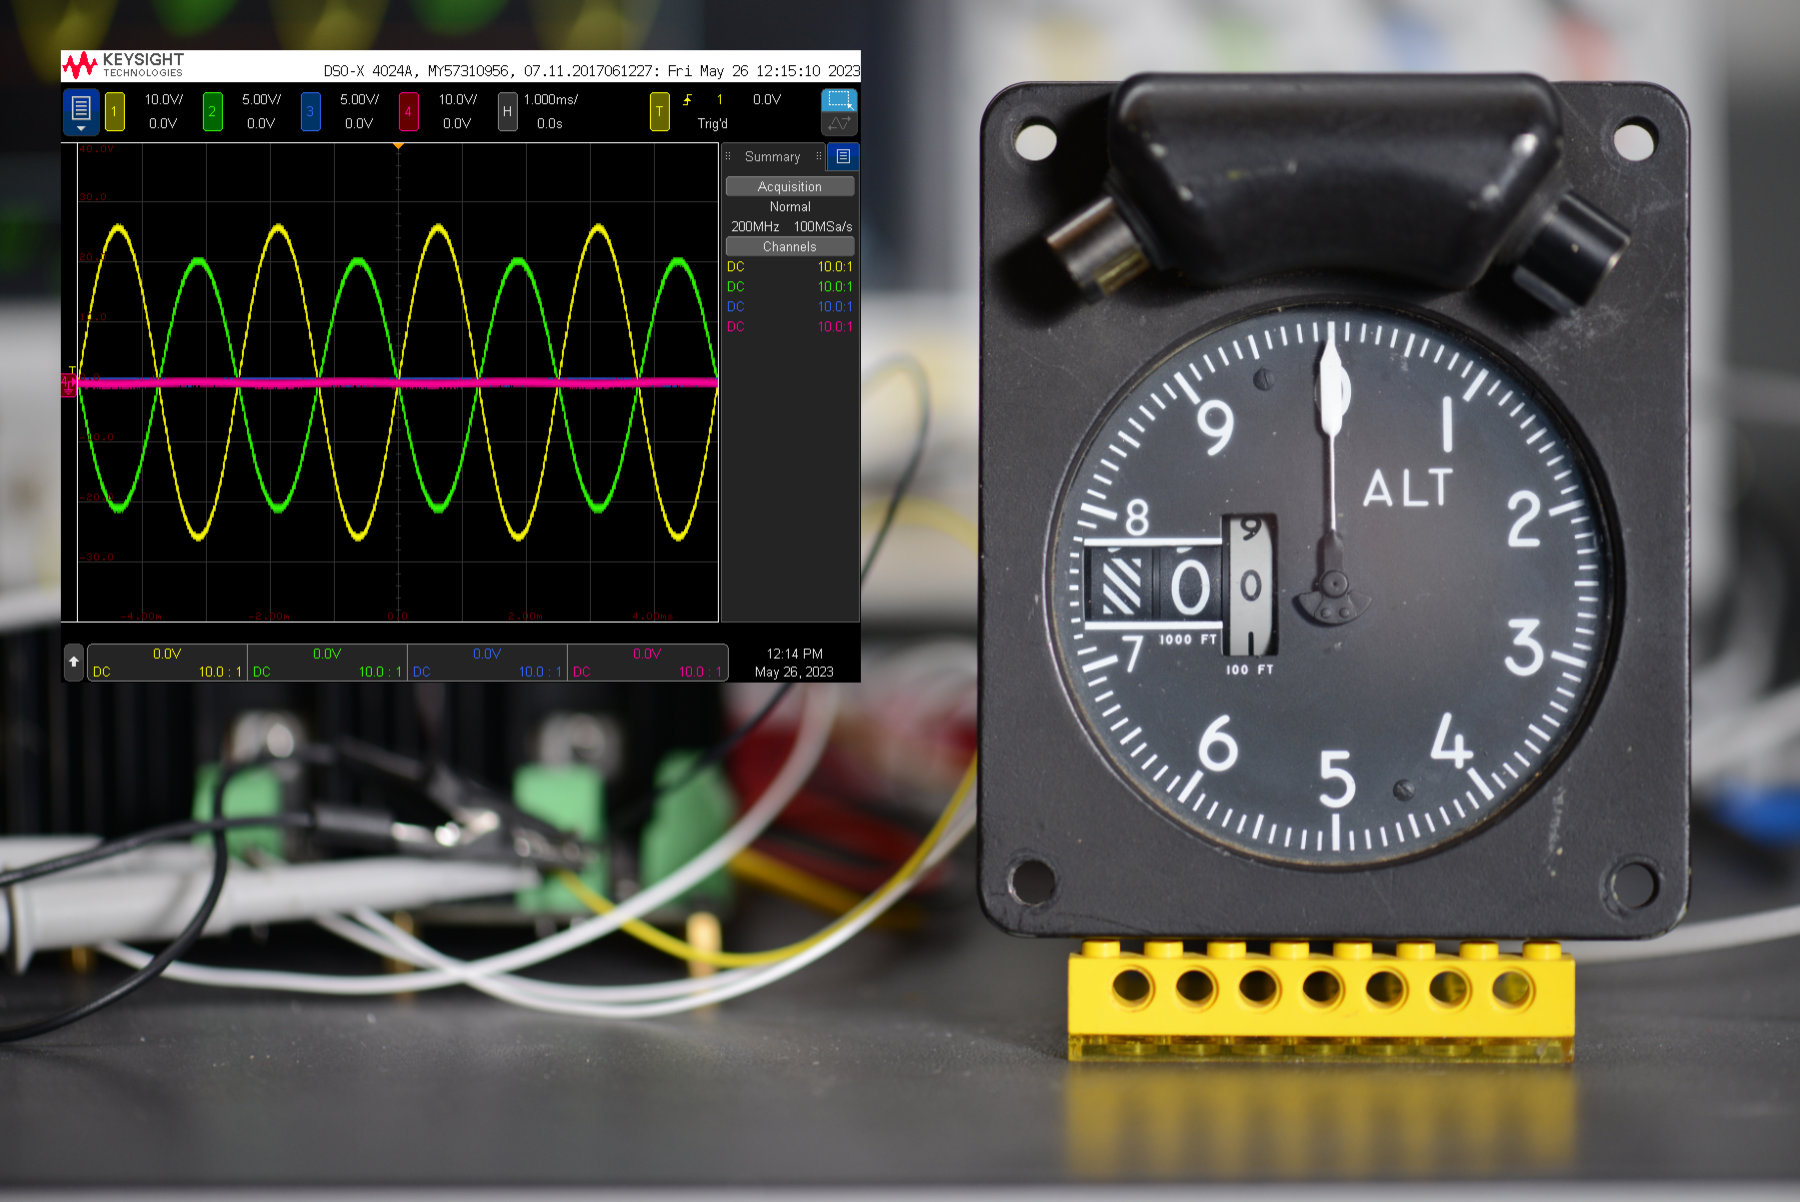
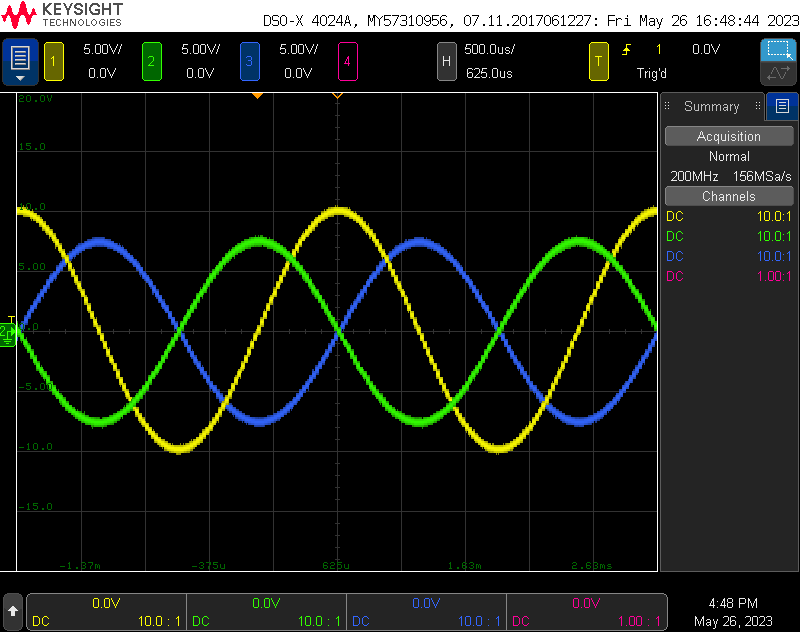
Control input set to 0 feet, 0 feet displayed on gauge, no error. The yellow oscilloscope trace is the 400 Hz AC power for the system. The green and blue traces are the control input. The red trace is the error signal.
If the control input is changed or the mechanical shaft’s angle is perturbed, the error signal will increase in magnitude. The error signal will either be in phase or 180° out of phase with the 400 Hz AC system power. In the figure below, I’ve left the control input at 0 feet but manually perturbed the displayed altitude to 800 feet. This results in an error signal that is in-phase with the system power:

Control input set to 0 feet, 800 feet displayed on gauge, positive error. The yellow oscilloscope trace is the 400 Hz AC power for the system. The green and blue traces are the control input. The red trace is the error signal.
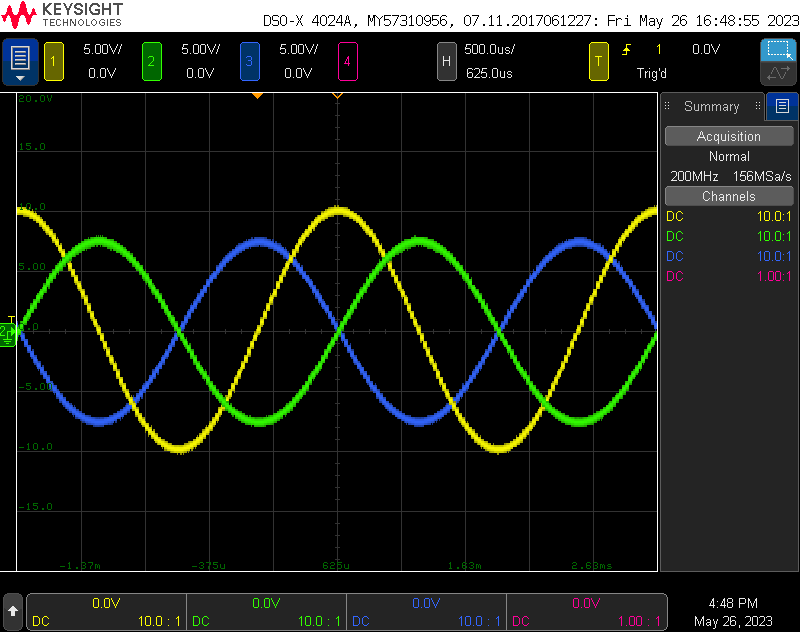
In the figure below, I’ve left the control input at 0 feet but manually perturbed the displayed altitude the other direction to -800 feet (99,200 feet). This results in an error signal that is 180° out of phase with the system power:

Control input set to 0 feet, 99,200 feet displayed on gauge, negative error. The yellow oscilloscope trace is the 400 Hz AC power for the system. The green and blue traces are the control input. The red trace is the error signal.
The control transformer output indicates the direction and magnitude of the error between the electrical control input and the mechanical feedback input. In a servo loop, this error is amplified by a servo amplifier and is used to control a servo motor to null the error signal. When the error signal is nulled, the output angle of the system will match the control angle input.
A video demonstrating how the synchro control transformer computes the difference between the electrical control input and the mechanical shaft input and outputs the difference as an electrical signal.
In the video above, I demonstrate the error signal reacting to the changes between the control input and the indicated altitude. I leave the control input at 0 feet and, with the servo power disconnected, manually change the indicated altitude to cause the error signal to indicate an error.
Servo Motor
The AC servo motor.
The altitude indicator contains a small AC servo motor-tachometer. The motor, through a series of gears, changes the displayed altitude and rotates the shaft of the control transformer. The tachometer is used when the error signal is small to increase the damping of the system to eliminate undershoots and overshoots near the null point.
The AC servo motor is a form of AC induction motor. AC induction motors have two windings. The first winding is the main winding and the second winding is the auxiliary winding. The AC voltages applied to these windings must be 90° out of phase with each other for the motor to spin. With large AC motors, the main winding is connected directly to the AC line and the auxiliary winding is connected through a capacitor to the AC line to get the necessary phase shift. The auxiliary winding may only be required to be powered to start the motor and is then disconnected from the circuit.
In small AC servo motors, the main winding is always connected to the AC line and the auxiliary winding is used to control the speed and direction of the motor. The auxiliary winding is commonly called the control winding since it is controlling the motor.
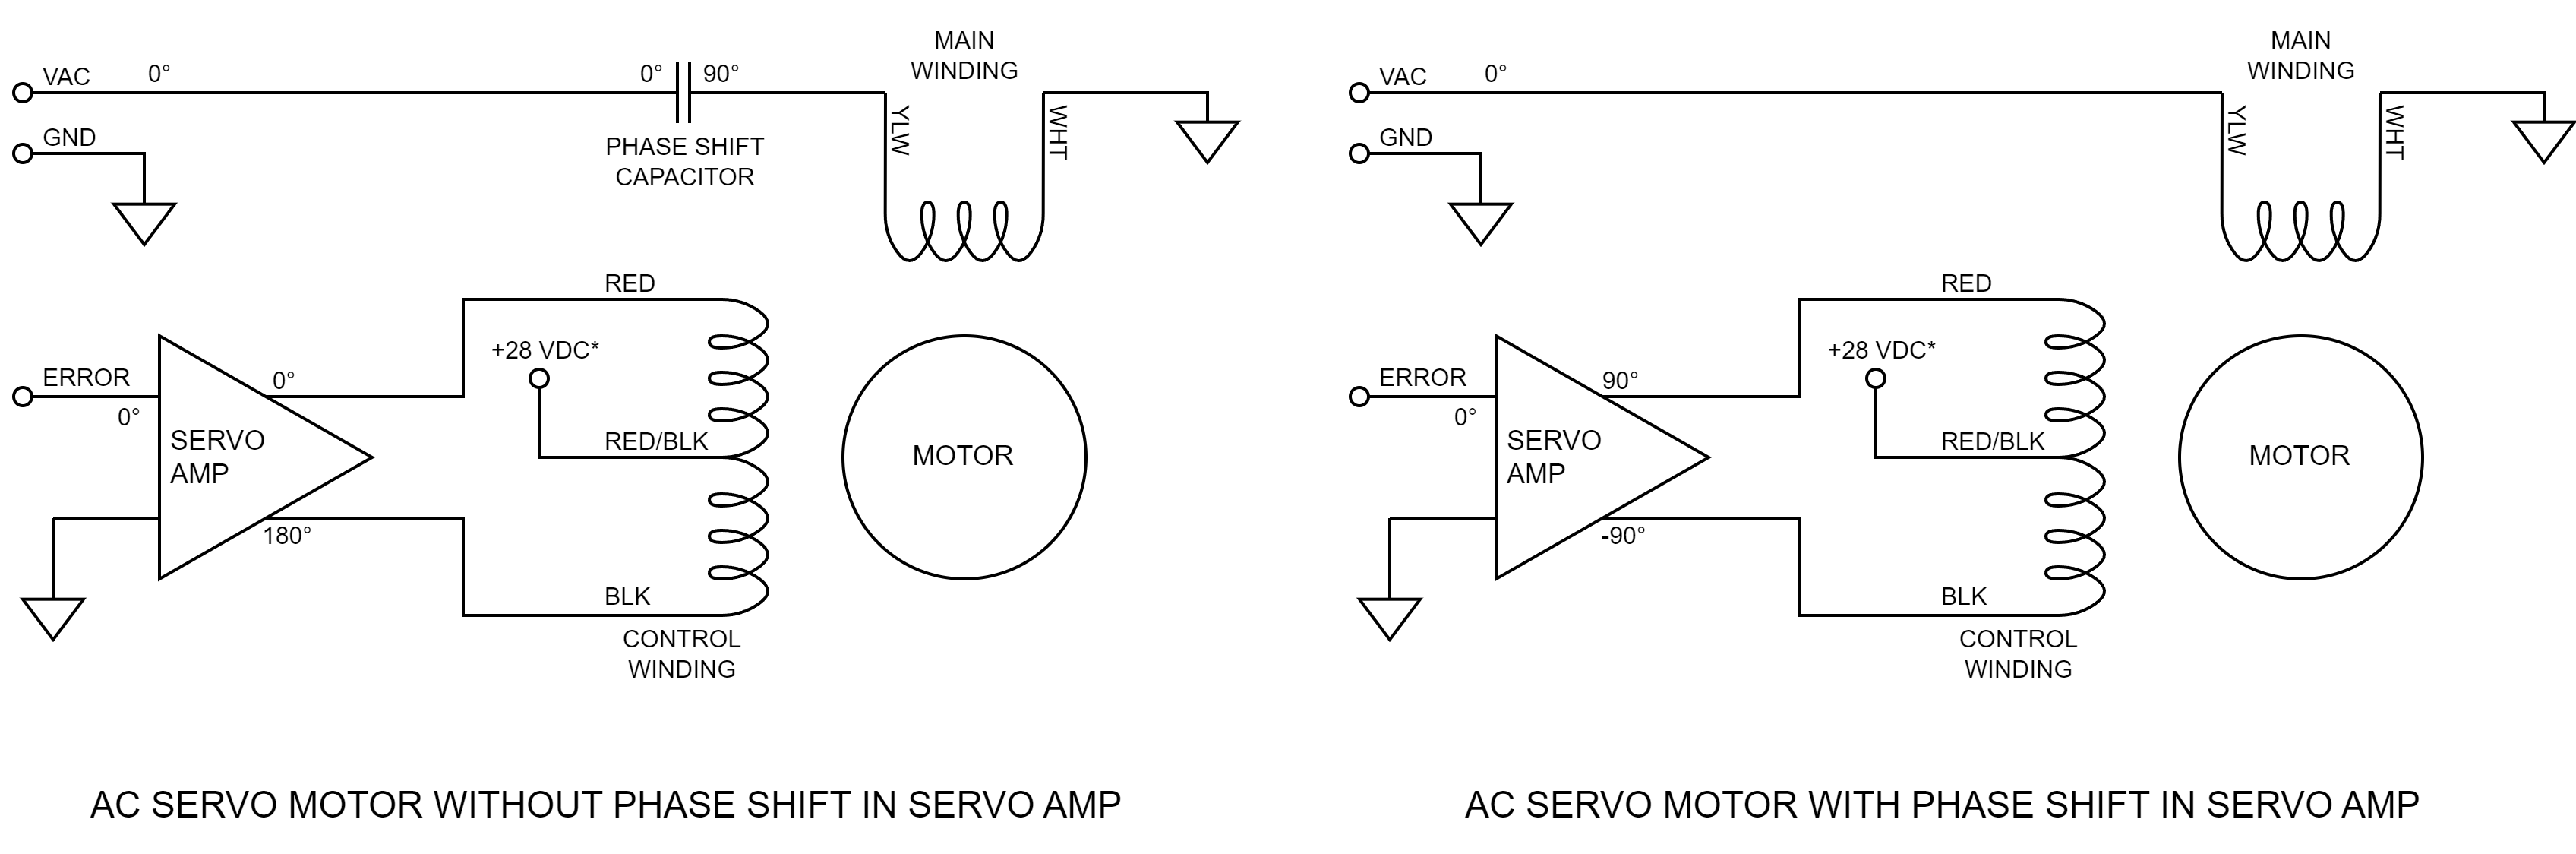
Phase shifts required for an AC servo motor.
If the output of the servo amp is not phase shifted with respect to the AC line power, a capacitor may be placed in series with the main winding to achieve the necessary phase shift (above left). If the output of the servo amp is phase shifted, the capacitor may be eliminated (above right). In the altitude indicator, the servo amp output is phase shifted so the capacitor is not needed.
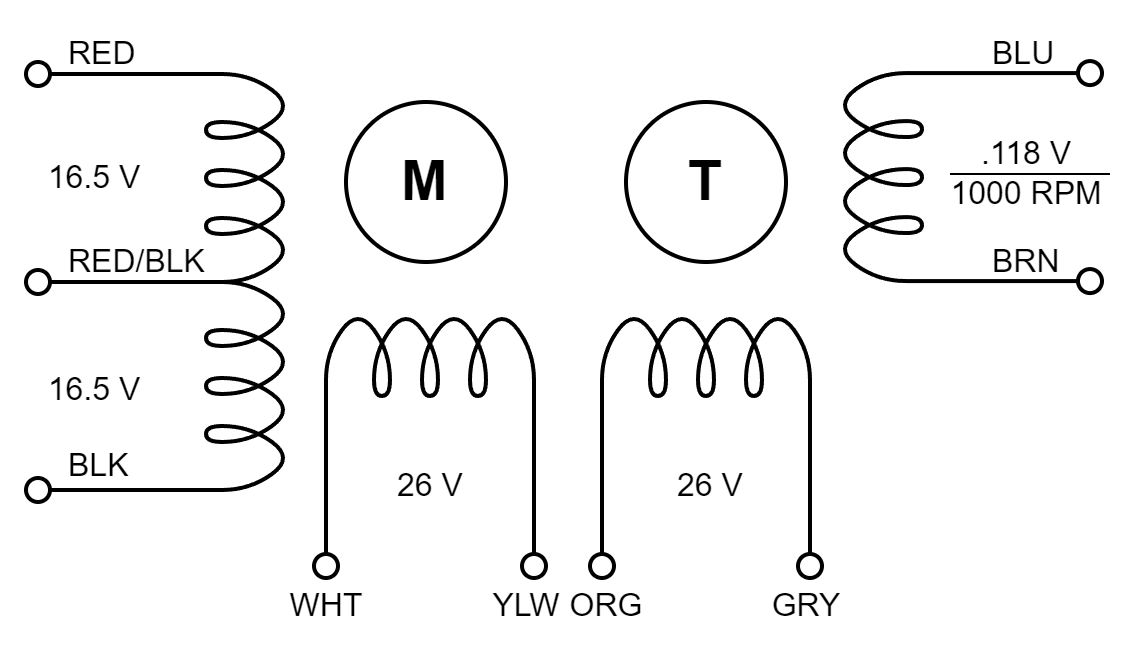
A block diagram for a typical combined motor-tachometer.
The figure above is the schematic for an AC servo motor tachometer similar to the one in the altitude indicator. The white and yellow leads are the main winding. In the case of this motor, the control winding is split in the middle and has three leads: red, red and black striped, and black.
The split in the control winding permits using a single DC supply rather than a split DC supply to power the servo amplifier. It also permits the use of only NPN transistors in the servo amplifier. More modern servo motors may not have a split control winding. These motors may use both PNP and NPN transistors in a push-pull arrangement with a split DC supply to power the control winding. In this case, the other lead of the winding will be connected to ground or the power supply mid point.
To make this motor spin, three voltages are required.
- a fixed-amplitude 400 Hz voltage across the yellow and white leads.
- a varying-amplitude 400 Hz voltage across the red and red/black leads that is 90° out of phase with respect to voltage (1).
- a varying-amplitude 400 Hz voltage of the same amplitude as (2) across the red/black and black leads that is -90° out of phase with respect to voltage (1).
The amplitude of the control voltages (2) and (3) determine the speed of the motor and whether (2) and (3) lead or lag (1) controls the direction of the motor.
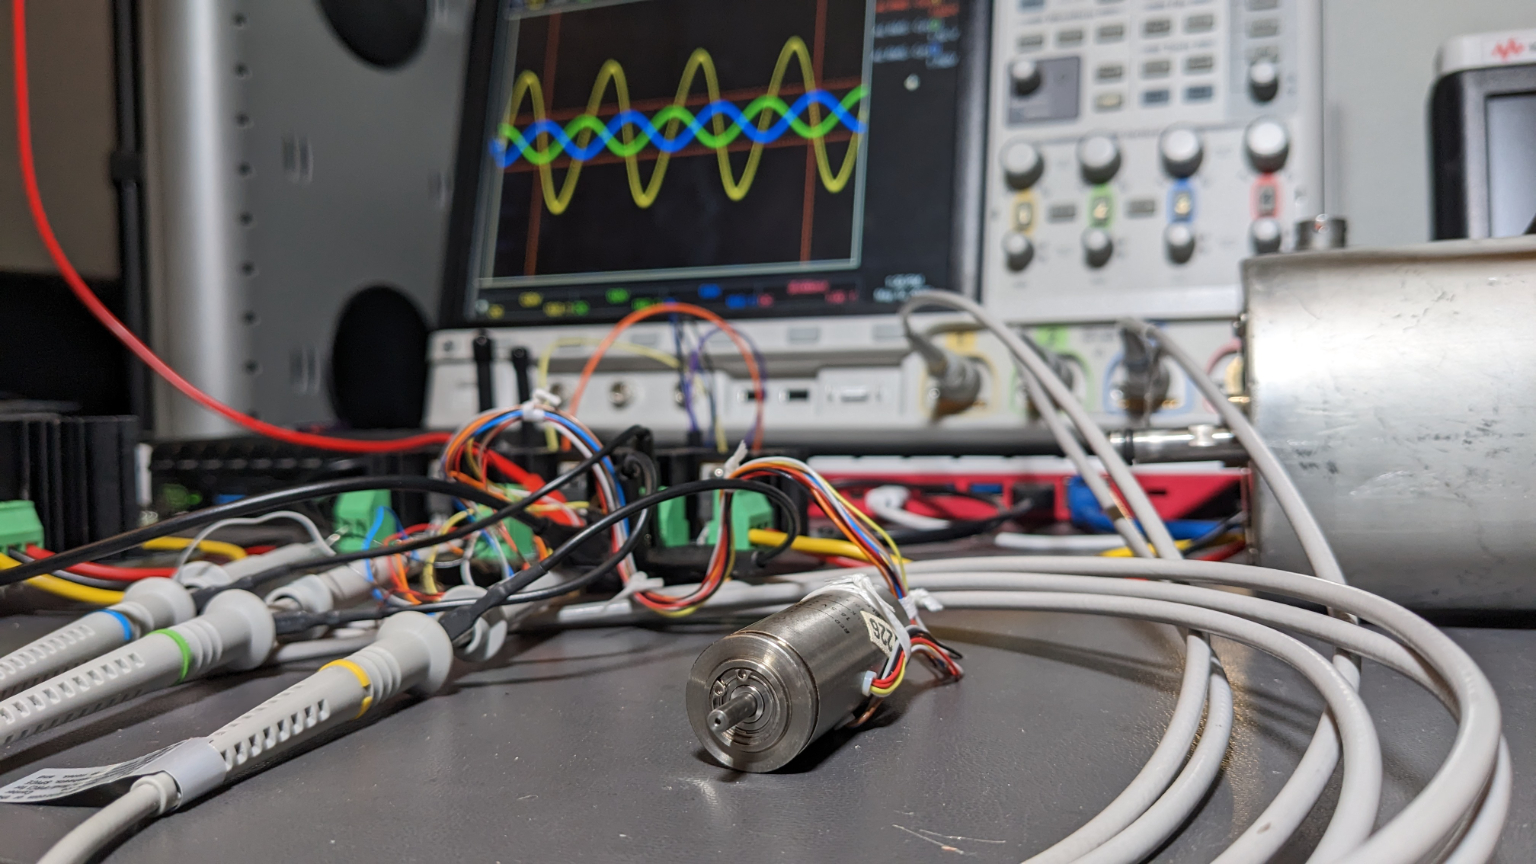
Driving a small servo motor.
To demonstrate this, I connected a small AC servo motor similar to the one in the altitude indicator to a small power arbitrary waveform generator and my oscilloscope. The motor and test setup is shown in the photo above.
Driving the split control winding AC servo motor in the forward direction.
The scope capture above shows the waveforms used to drive the motor in the forward direction. The yellow trace shows the voltage on the main winding’s yellow lead. The green trace shows the voltage on the control winding’s red lead. The blue trace shows the voltage on the control winding’s black lead. The main winding’s white lead and the control winding’s red/black lead are both connected to ground.
Driving the split control winding AC servo motor in the reverse direction.
The scope capture above shows the waveforms used to drive the motor in the reverse direction. The scope and ground connections are the same as above. Notice that the green and blue traces have shifted places on either side of the yellow trace versus the previous capture.
Servo Amplifier

The Bulova servo amplifier.
The servo amplifier in the altitude indicator is a transistor-based module made by Bulova. It amplifies and phase shifts the error signal input to create two output signals to control a split control winding AC induction servo motor.
The first output signal has a phase shift of 90° compared to the error input. The second output signal has a phase shift of -90° compared to the error input. In other words, the second signal is the negative of the first signal and the amplifier has a differential output.
The servo amplifier phase shifts the outputs to eliminate a large capacitor in series with the main winding of the servo motor. I’ve seen other Bulova servo amplifiers that do not have this 90° phase shift. In this case, a large capacitor is in series with the main winding of the servo motor to shift the main winding rather than the control winding by the 90° required to power an AC induction motor.
| Pin | Function |
|---|---|
| 1 | Signal Input |
| 2 | Signal Ground |
| 3 | Case Ground |
| 4 | +28 VDC Power |
| 5 | Output 90° |
| 6 | Output 270° (aka -90°) |
| 7 | Power Ground |
The servo amp is socketed and has seven pins. Fortunately, the servo amp has a nameplate with its pinout on the back of it. The pinout is shown in the table above. Knowing that pin 4 required +28 VDC was invaluable in figuring out how to power the altitude indicator.
I did a search for servo amplifier patents and found two relevant patents. The first is US patent 2,951,991 for a transistor servo amplifer. It is assigned to the US government through the Navy. The second is US patent 3,105,199 for a transistorized amplifier assigned to Bulova Research and Development Laboratories.
I found the first patent helpful because it showed how an AC error signal connected to a servo amplifier powered by a DC power supply could drive a split control winding AC servo motor. I found the second patent helpful because it likely very closely matches the circuit inside the Bulova servo amp inside the altitude indicator and gave me an idea of what sorts of connections to be looking for to and from the amplifier (before I found the pinout nameplate).

Bulova servo amplifer patent.
The schematic from US 3,105,199 is shown in above. It has a single ended-input with a differential output and is powered by a DC power supply. Tying the center of the motor’s control winding to +28 VDC instead of ground permits the use of higher-performance NPN transistors over PNP transistors. The only thing missing in the schematic compared to the Bulova amp in the indicator is a phase shift circuit to shift the error signal by 90°.
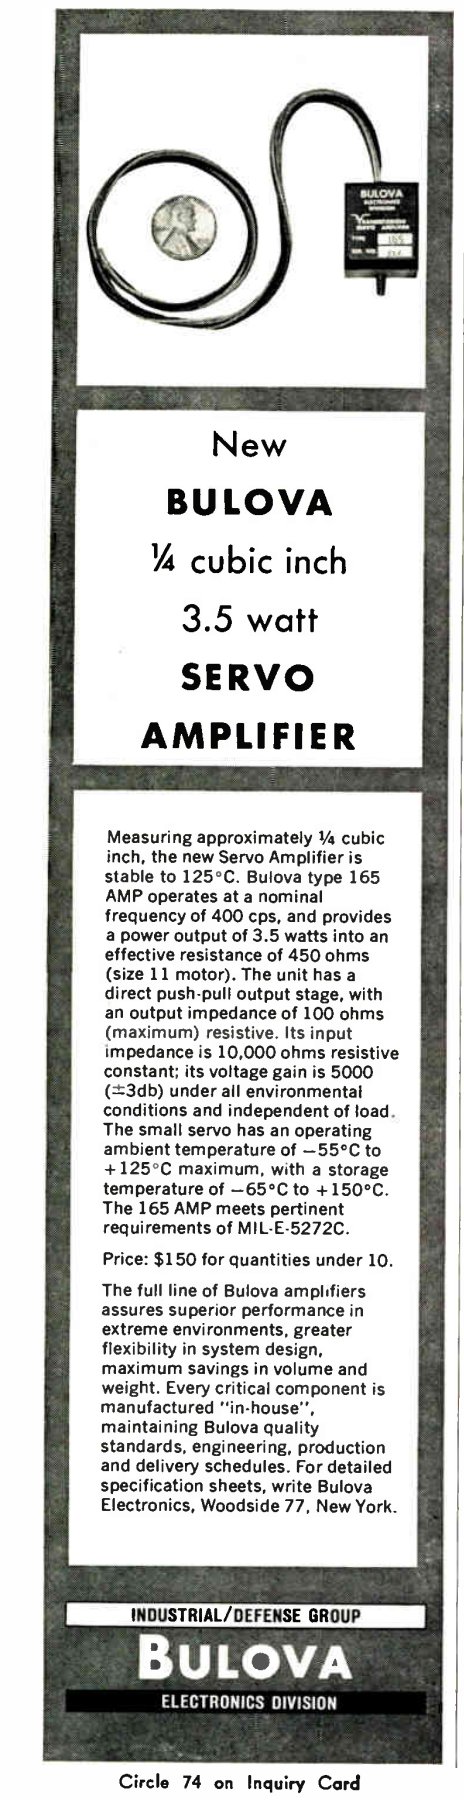
Bulova servo amplifier ad.
While searching for information on the Bulova servo amp, I found an ad from 1964. This is not an identical servo amp but it’s very similar and from the same time frame. The indicator’s servo amp has pins for a socket. The one in the ad has fixed wired connections with a mounting screw opposite the wires. The indicator’s servo amp has a 90° phase shift relative to the input error signal. The one in the ad does not.
The most interesting part of the ad is that the servo amp was available for $150 in small quantities. $150 in 1964 dollars is about $1465 in 2023 dollars. The servo amp was not an inexpensive component even though it likely only contained about a half dozen transistors and some passives!
Putting it All Together to Make a Servo Loop
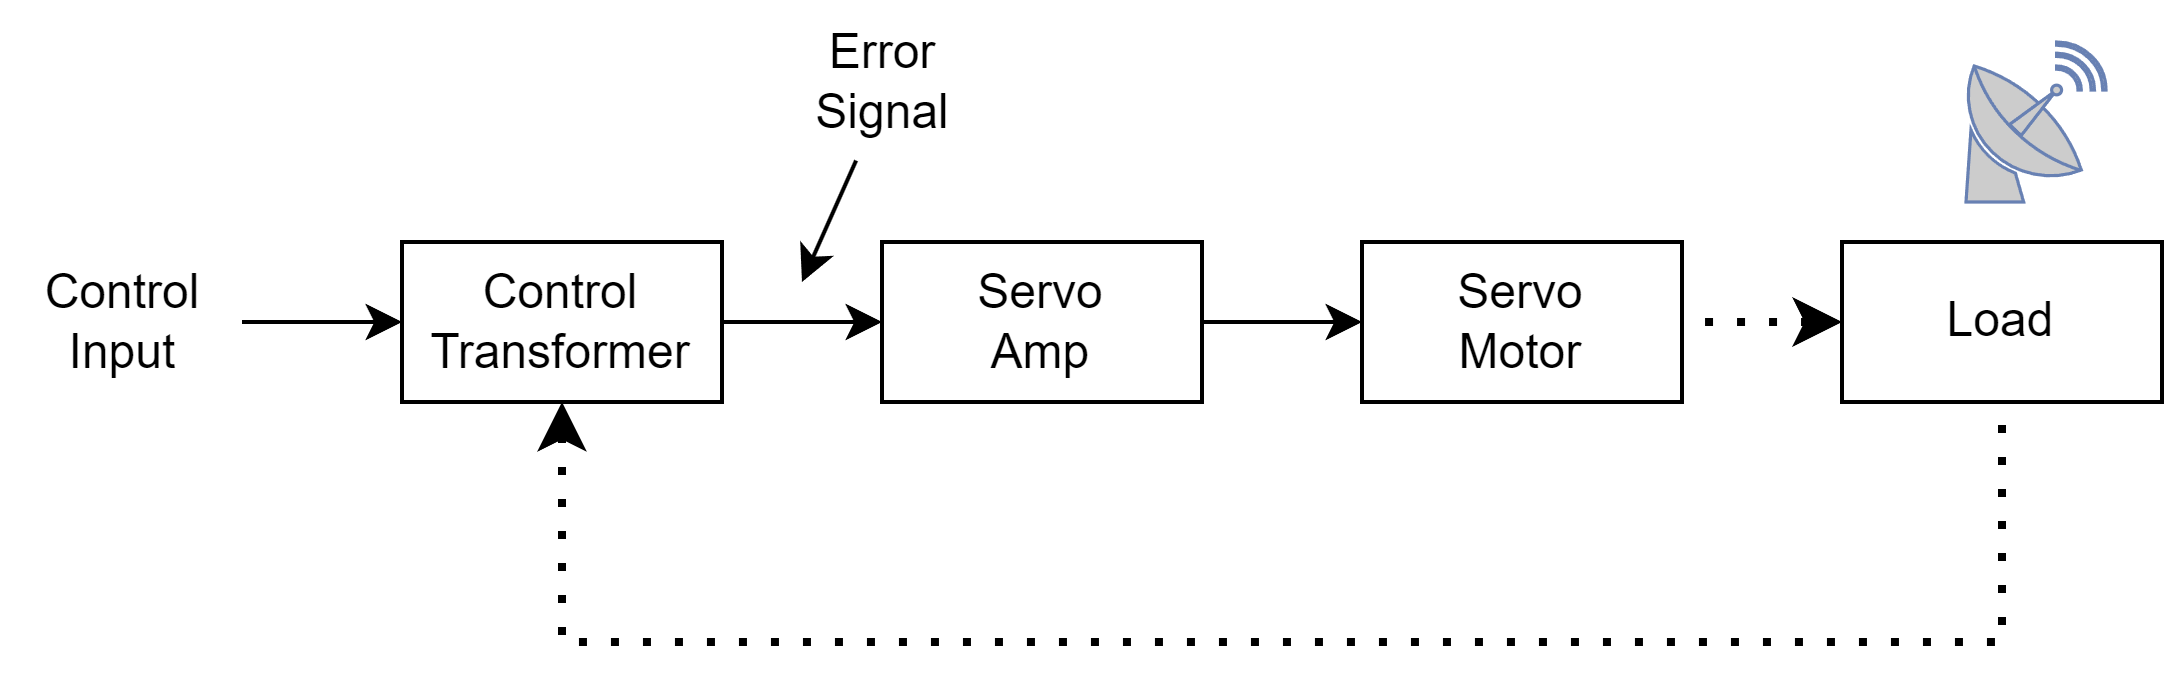
Simplified generic servo loop.
The block diagram above shows a simple servo loop. The solid lines are electrical connections and the dotted lines are mechanical connections. The control transformer outputs the error between the control input and the actual position of the load. This error signal is amplified by the servo amp and used to drive a servo motor that rotates the load to null the error signal from the control transformer.

Simplified block diagram of the altitude indicator’s servo loop .
The block diagram above shows a simplified version of the servo loop inside the altitude indicator. The 26 VAC (actually ~18 VAC) for the main winding comes from channel 1 of the D2S board. The control inputs, S1 and S3, come from channels 2 and 3 of the D2S board respectively. S2 is connected to ground. The 28 VDC for the servo amplifier comes from a bench supply.
The load to be positioned in the case of the altitude indicator is the pointer, drum counter, and two synchro transmitters. The synchro transmitters function as repeater to relay the indicated altitude to additional altitude displays or to an altitude alerter. I expected the pair of transmitters to indicate the coarse and fine altitude but they’re both geared the same. These are all connected together and to the control transformer using a ton of gears.
The main winding power and control inputs are 400 Hz AC signals and are all in phase with each other. The error output from the control transformer is in phase with these signals as well. The servo amplifier shifts its (+) output by 90° and its (-) output by -90°. This causes the servo motor’s main winding and control winding to be 90° out of phase with each other enabling the magnetic fields in the servo motor to rotate the rotor.
Changes in the control input, like the Python script sending the next point in the elevation profile to the D2S converter, cause the error signal to be non-zero. The error signal is phase shifted and amplified to turn the servo motor. The servo motor turns the pointer, counter, synchro transmitters, and control transformer in the direction to null the error. When the error is nulled, the servo motor stops turning and the indicated altitude now matches the sent point from the elevation profile.
Not shown in the block diagram is the servo motor’s tachometer. I’m not 100% certain how the tachometer influences the servo loop other than its used to damp the system to eliminate undershoots and overshoots near the null point. I need to find and read a few more patents from the era to understand the use of tachometers in servo loops better.
Connecting the D2S Board to the Altitude Indicator
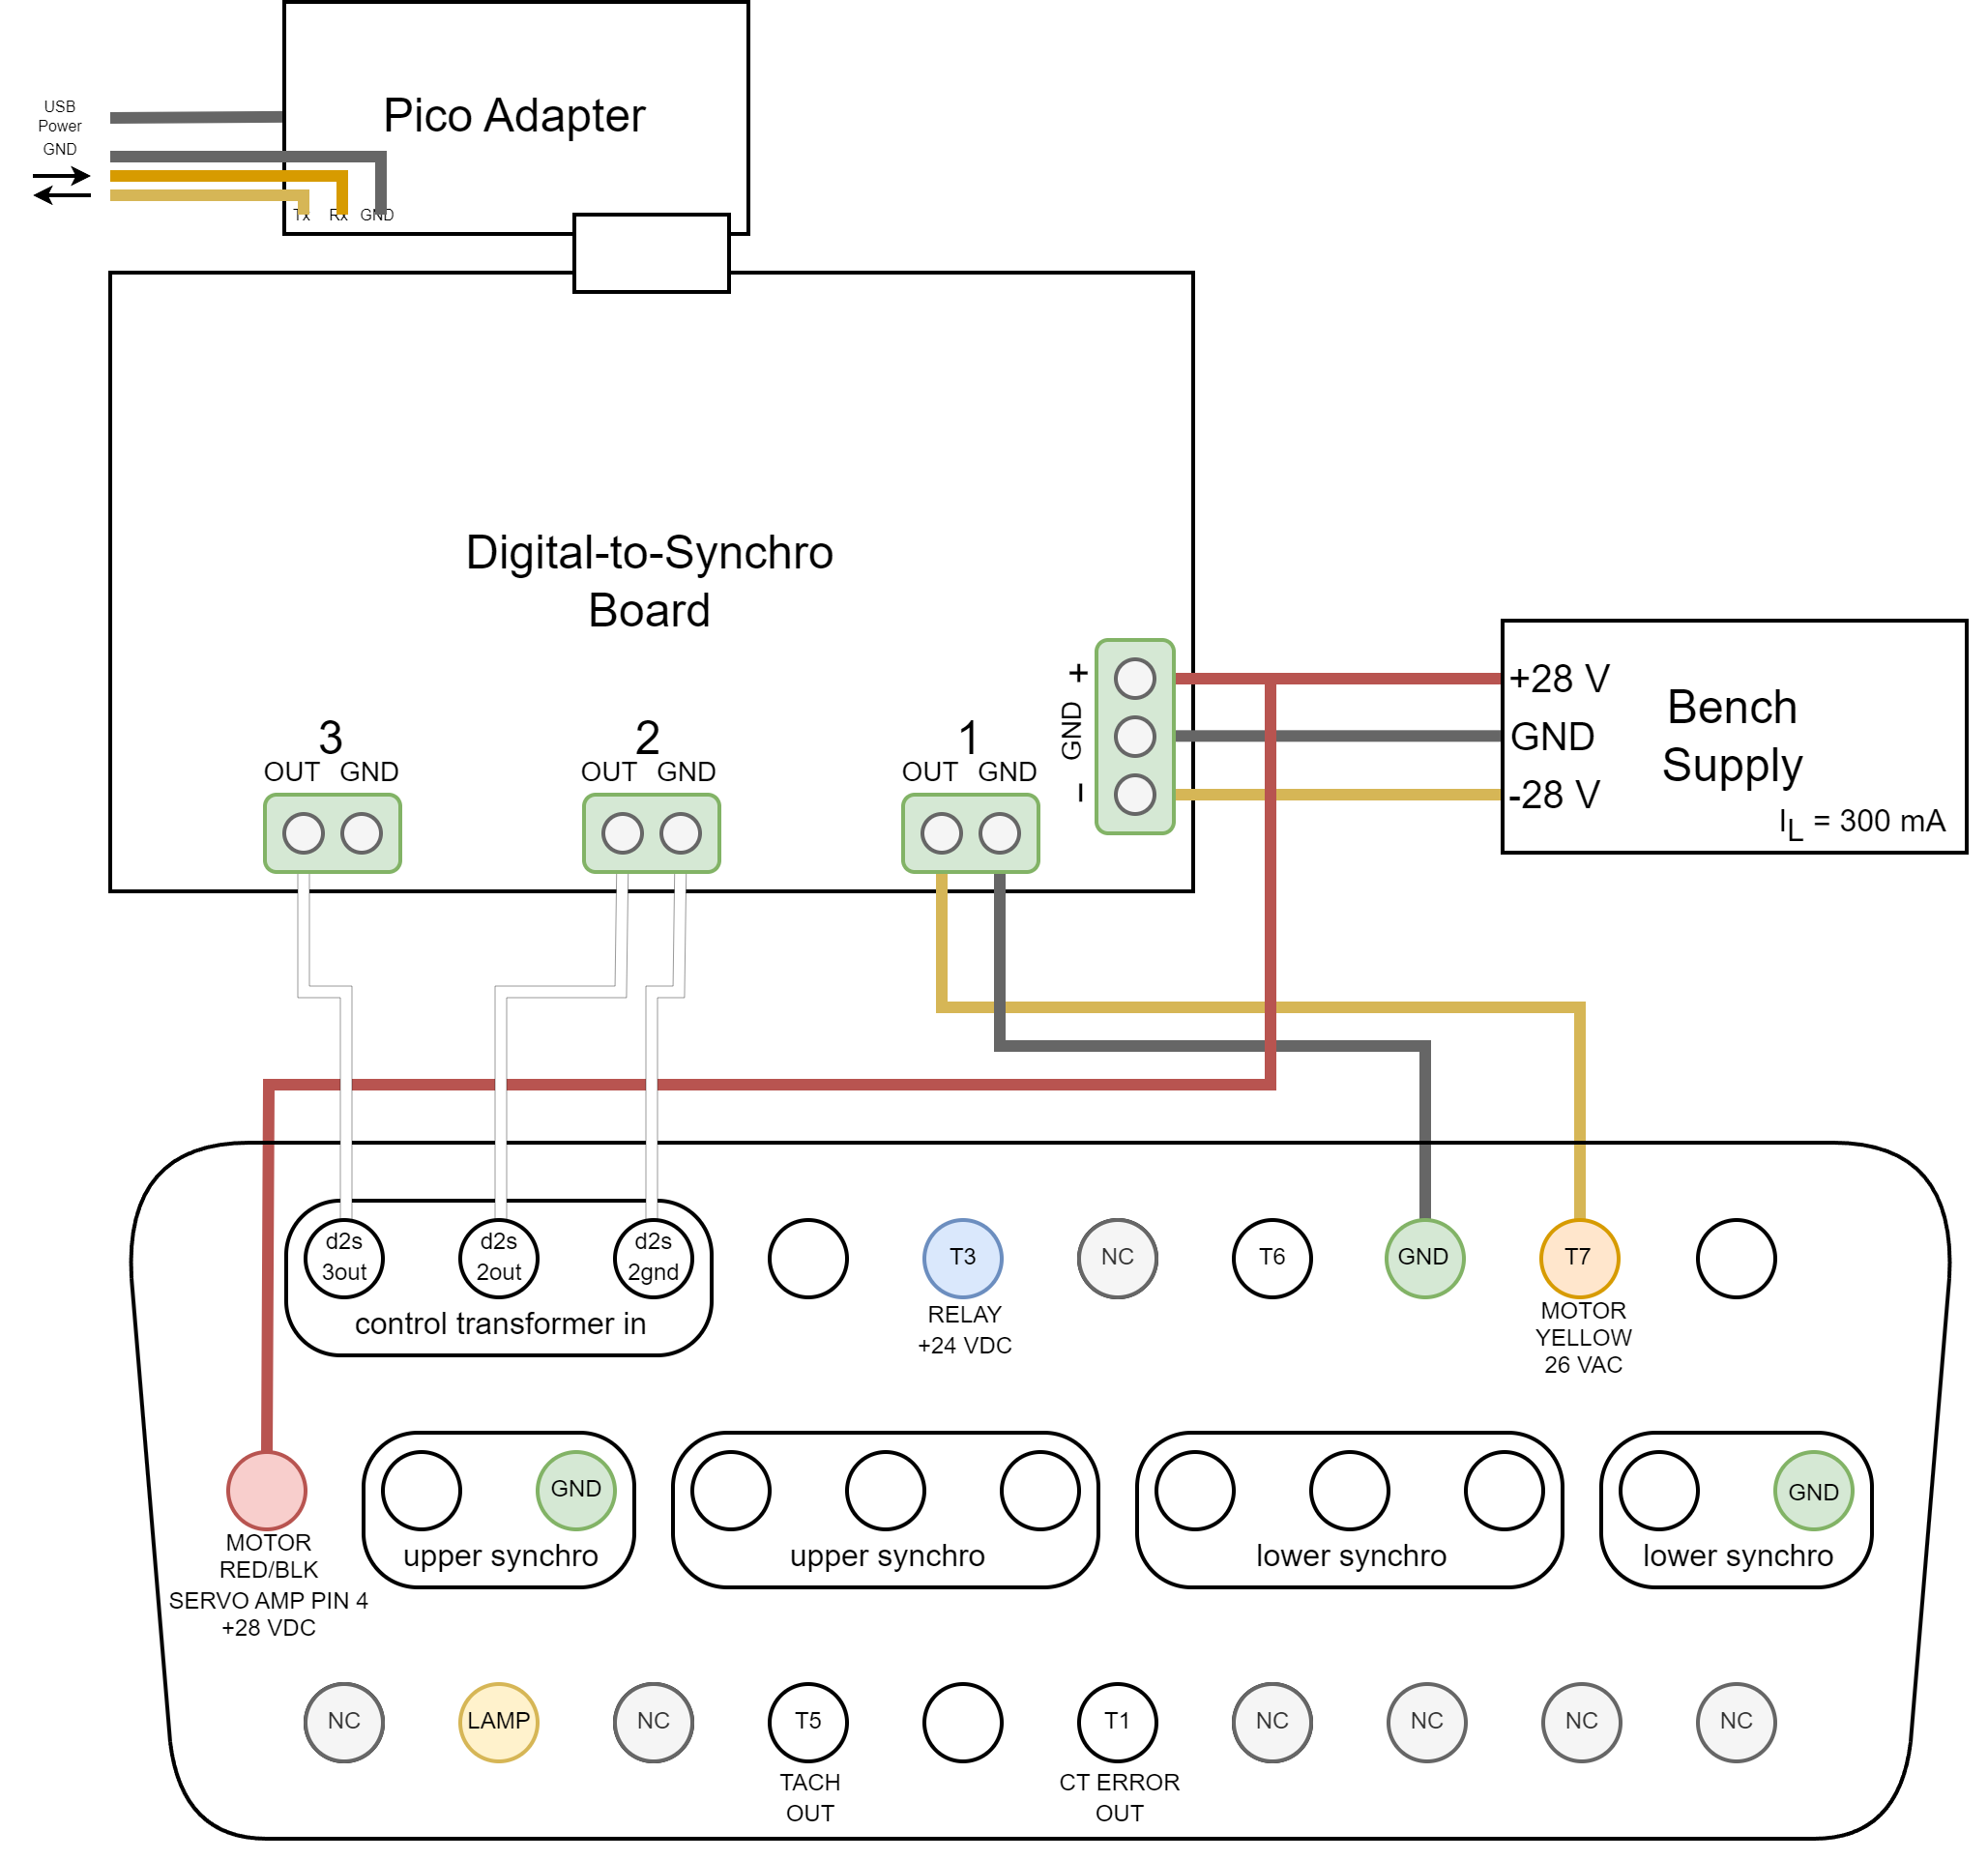
Connections and reversed engineered connector pinout.
The test setup connections and reverse-engineered pinout for the altitude indicator is shown above. I’m unsure of the function or connection of the pins with a (?).
In my experiments, I only connected the control transformer input pins, the ground pin in the top row, the motor supply pin, and the servo amp supply pin. I soldered a jumper wire between the relay contacts so I don’t need to power the relay pin in the top row. I also found the indicator worked better with a 10 kΩ resistor between the control transformer error output and ground. I soldered this resistor inside the unit as well.
Final Thoughts
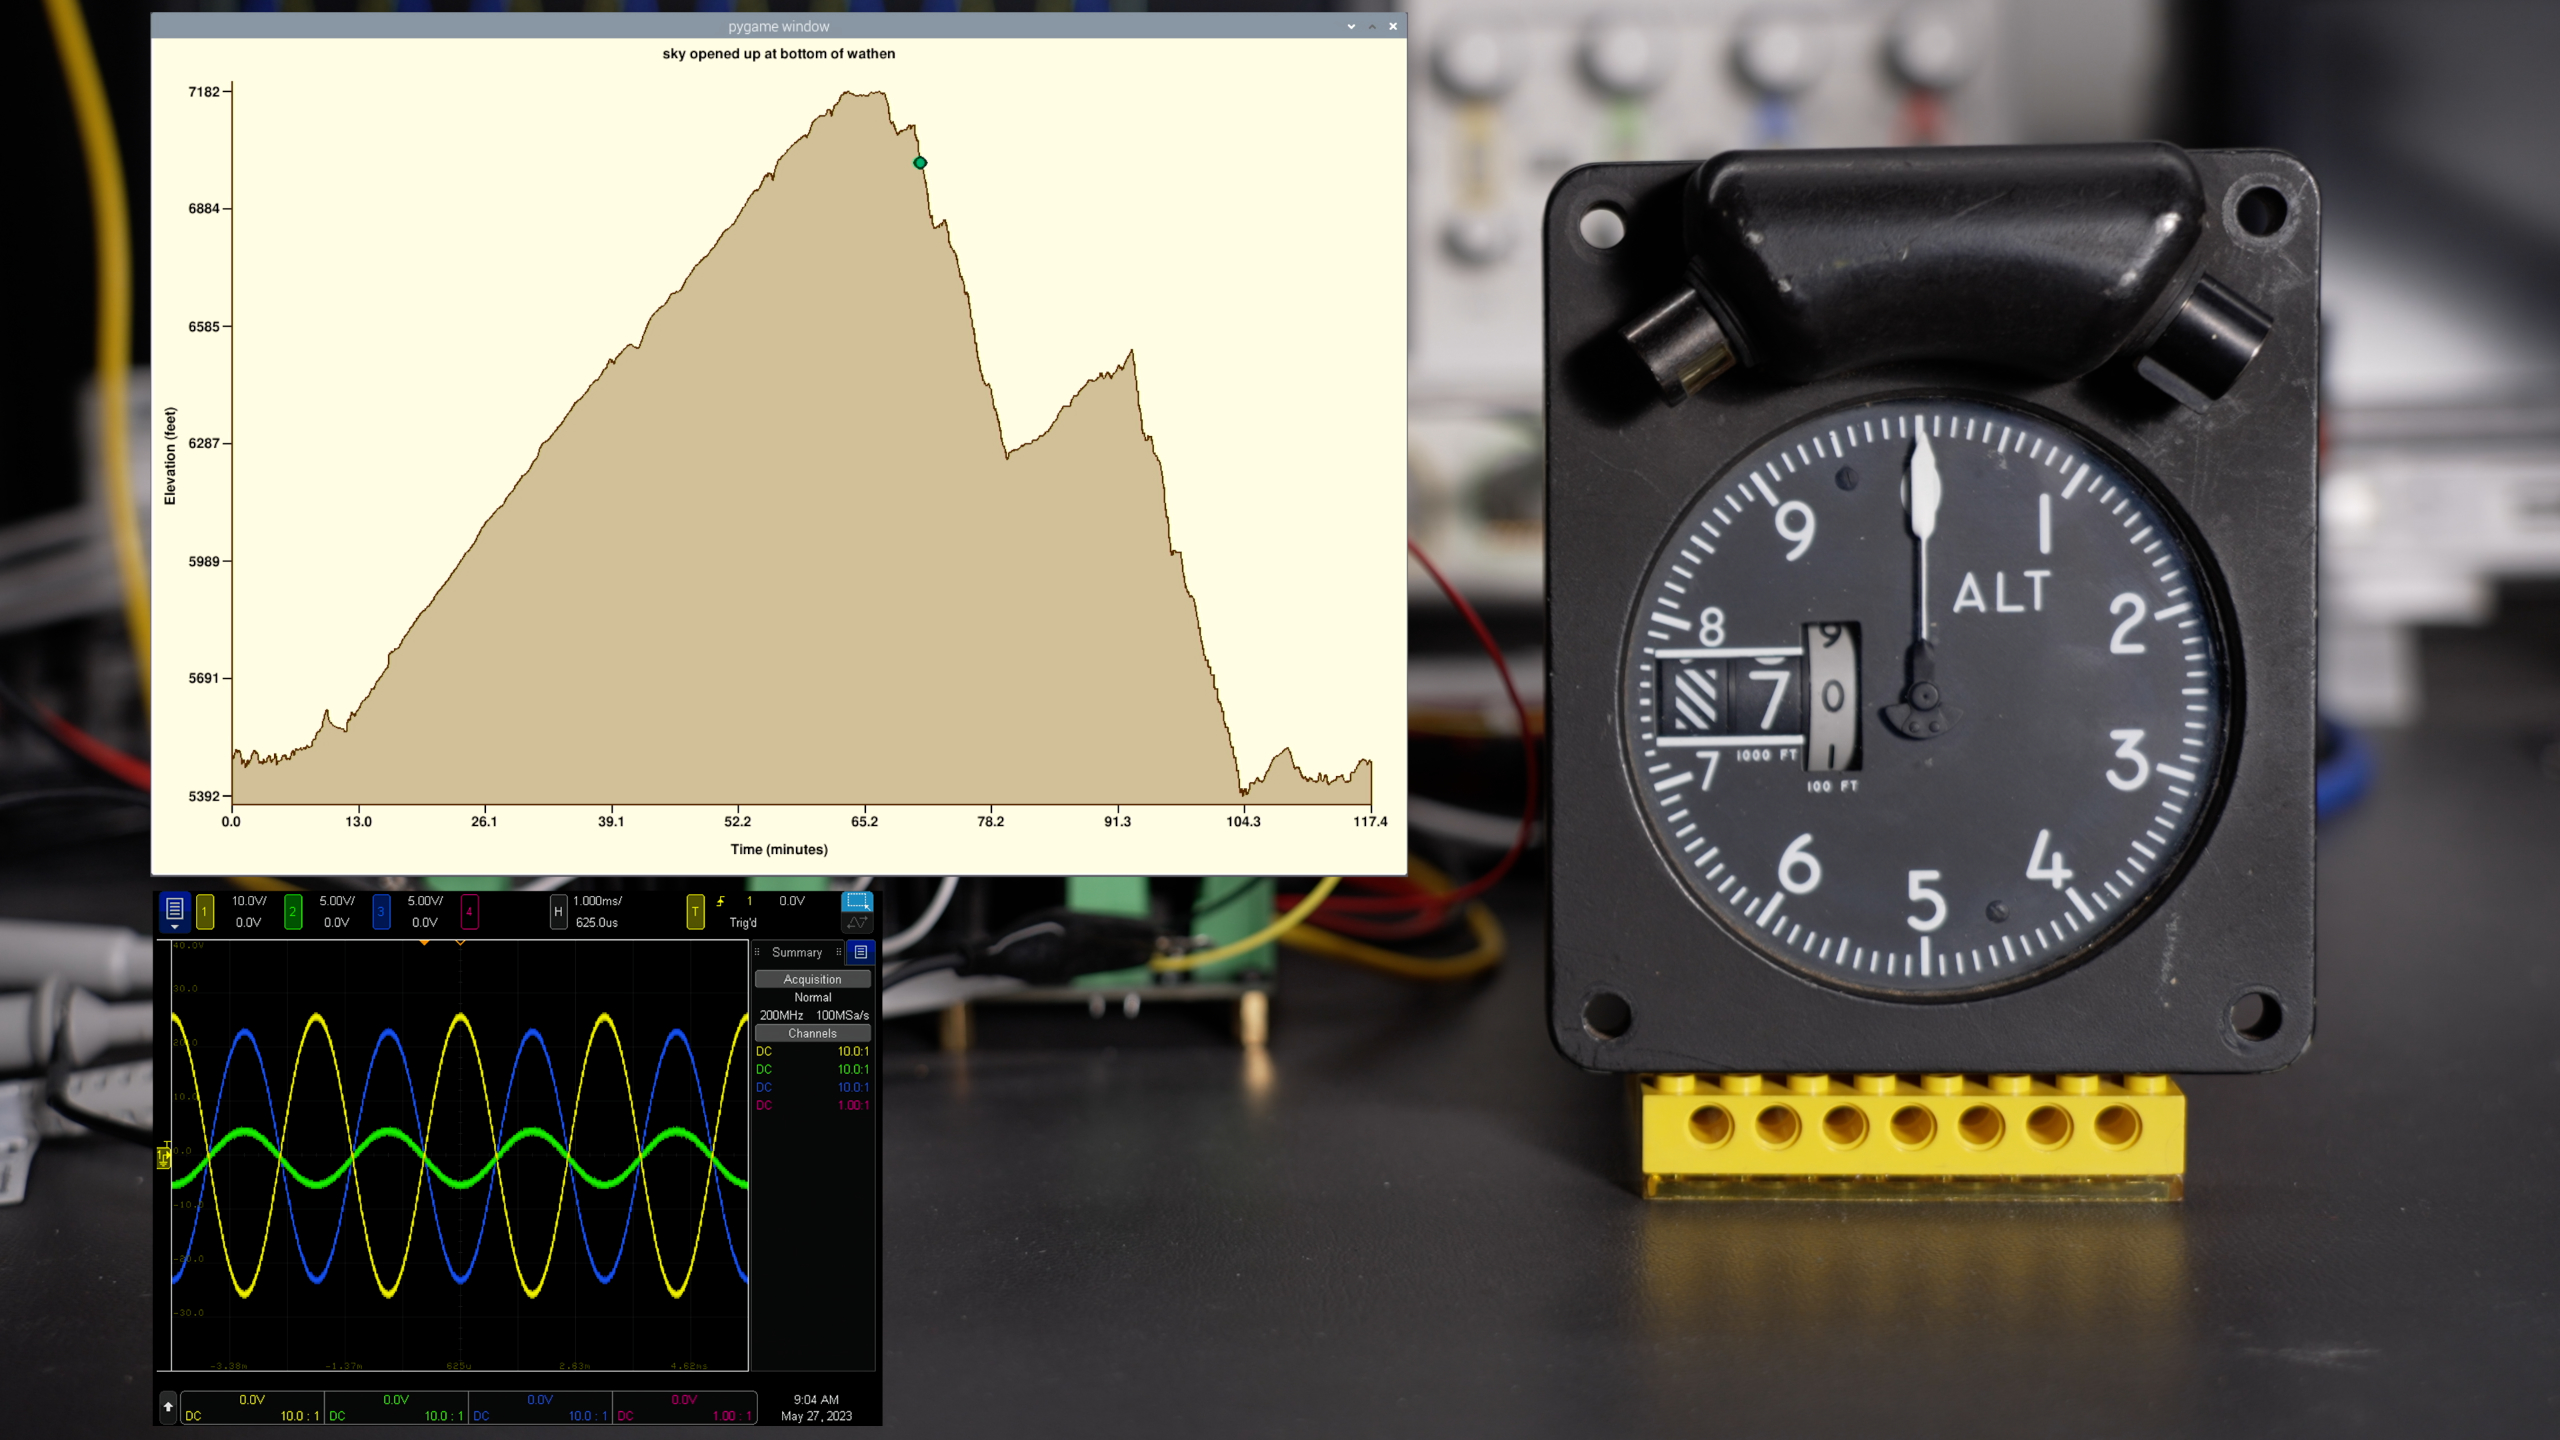
A frame capture from the demo video.
This project was a fun and creative way to use software and op amps to power and control a vintage aviation device.