
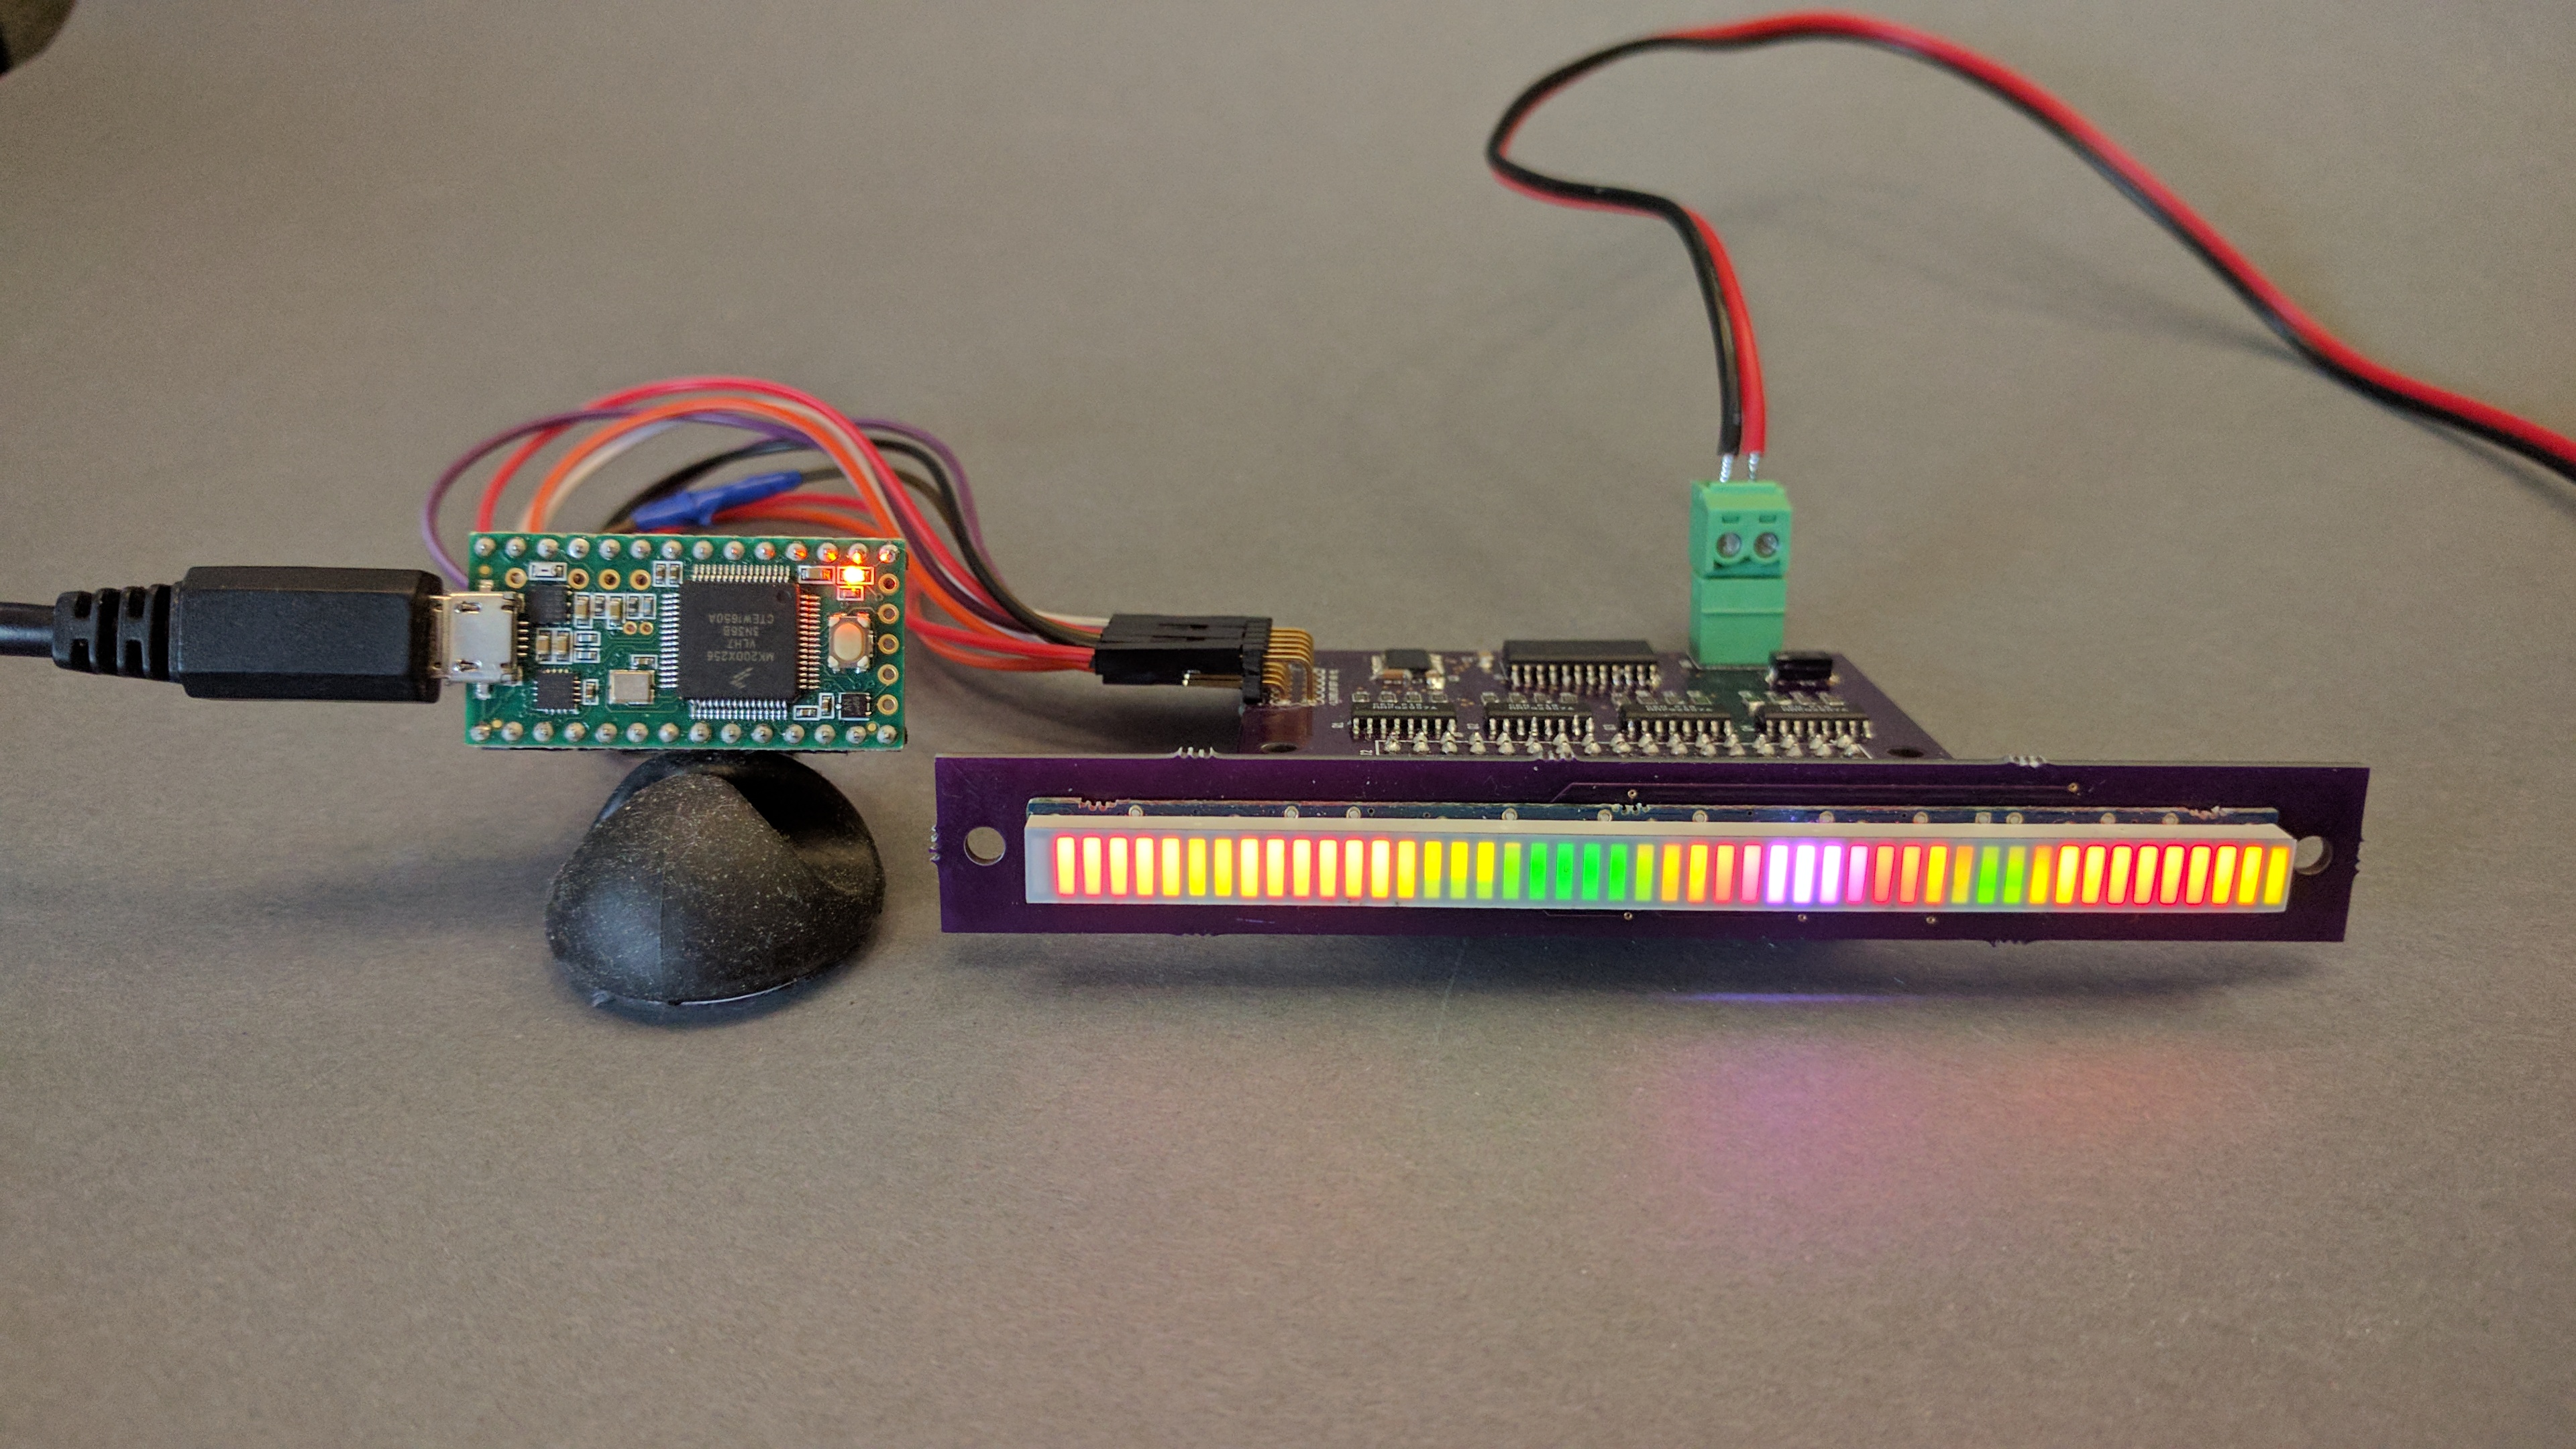
A Teensy 3.2 driving a SparkFun 48-segment RGB LED bar graph display using the hardware built in a previous post.
In my post Driving a SparkFun 48-Segment RGB LED Bar Graph, I stated that the hardware built there could be used to drive the LED bar graph with any combination of hardware and software that could drive one of the common 32×32 or 32×16 RGB LED matrices. Today I’m back to prove that point. In this post, I ditch the FPGA and drive the 48-segment RGB LED bar graph using a Teensy 3.2 board and the Pixelmatix SmartMatrix 3 library.
Hardware
If you haven’t already, read my post Driving a SparkFun 48-Segment RGB LED Bar Graph and build the hardware described there. The next step is to connect the Teensy to the driver board. Use jumper wires to connect the Teensy and driver board as shown in the following chart:
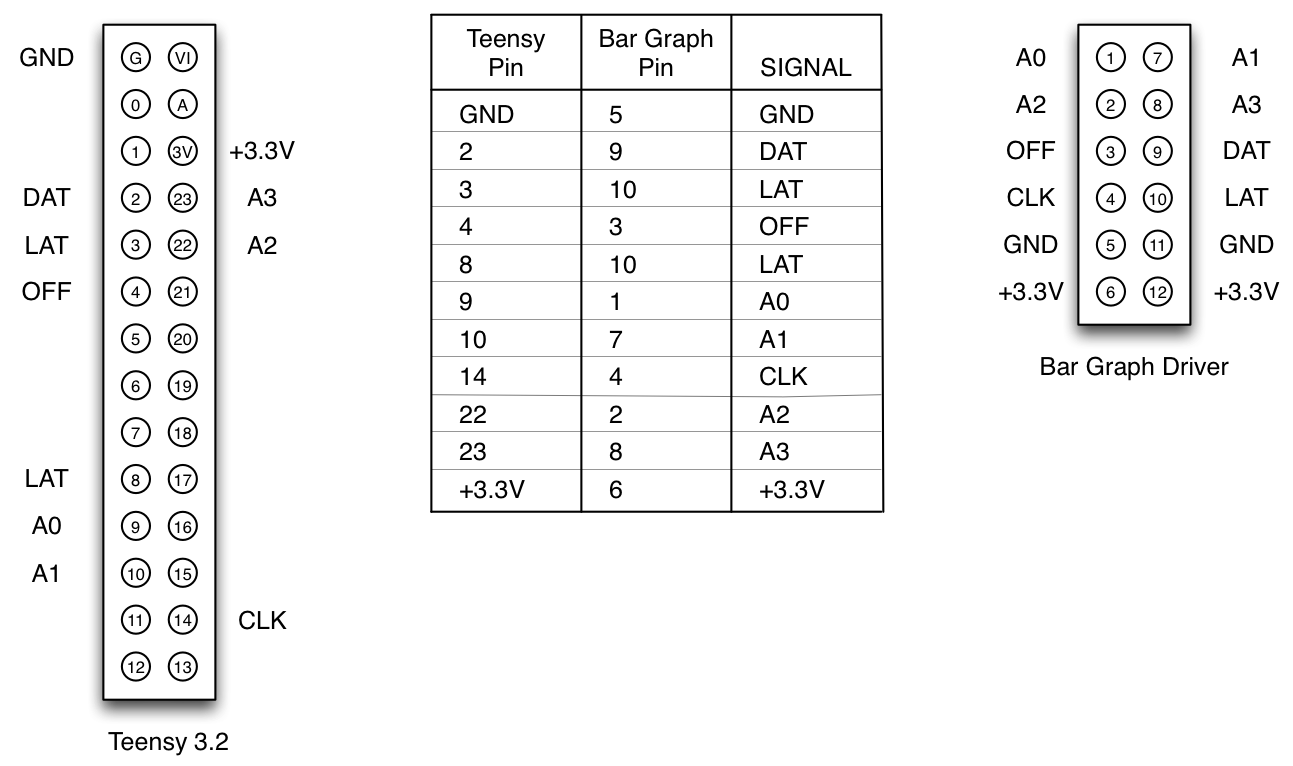
Teensy 3.2 and bar graph driver board connections.
Note that the latch signal must be connected to two pins on the Teensy board. Once the connections are verified, you can plug the Teensy into a USB port on your development machine and plug a source of +5V power into the bar graph driver board.
Development Environment
Installing the development environment involves installing the Arduino environment, the Teensy 3.2 environment, and the SmartMatrix library.
- Download and install the Arduino IDE.
- Download and install the Teensyduino add-on for Arduino.
- Clone or download the SmartMatrix library to your development machine.
- Install the SmartMatrix library using the instructions in the SmartMatrix library’s README file.
Software
Clone or download my Teensyduino sketch to your development machine and program the Teensy with the sketch. With any luck, a pseudorandom Perlin noise pattern will be displayed on the bar graph display. If not, check your connections and try again.
Digging Deeper
Because I did not modify the SmartMatrix library, I have to map my RGB segments to where they occur in the SmartMatrix library’s display buffer for a normal 32×32 RGB LED matrix. Furthermore, all three bar graph LED colors are controlled by only the red channel in the matrix’s display buffer. The green and blue channels of the display buffer are not used. The 23 leftmost columns and 16 bottom rows of the display buffer are not used either.
These two lines of code map a segment number from 0 to 47 to the row and column location of that segment in the 32×32 RGB matrix’s display buffer:
uint8_t row = n / 3;
uint8_t col = 29 – 3 * (n % 3);
n is the segment number to map. col and row are the x-y location of that segment in the matrix’s display buffer. After running these two lines of code, segment n’s red pixel is stored in the red channel of the display buffer at (col+0, row). Segment n’s green pixel is stored in the red channel of the display buffer at (col+1, row). Segment n’s blue pixel is stored in the red channel of the display buffer at (col+2, row).
Exploring Further
Using a Teensy 3.2 significantly reduces the amount of hardware required to drive one of these bar graphs. It also significantly reduces the design complexity for someone who is not used to writing Verilog or building FPGAs. Two project ideas would be to build an audio level meter using an analog input on the Teensy board or to build a generic panel meter that could take a measurement input on the Teensy’s UART and display the measurement on the bar graph.